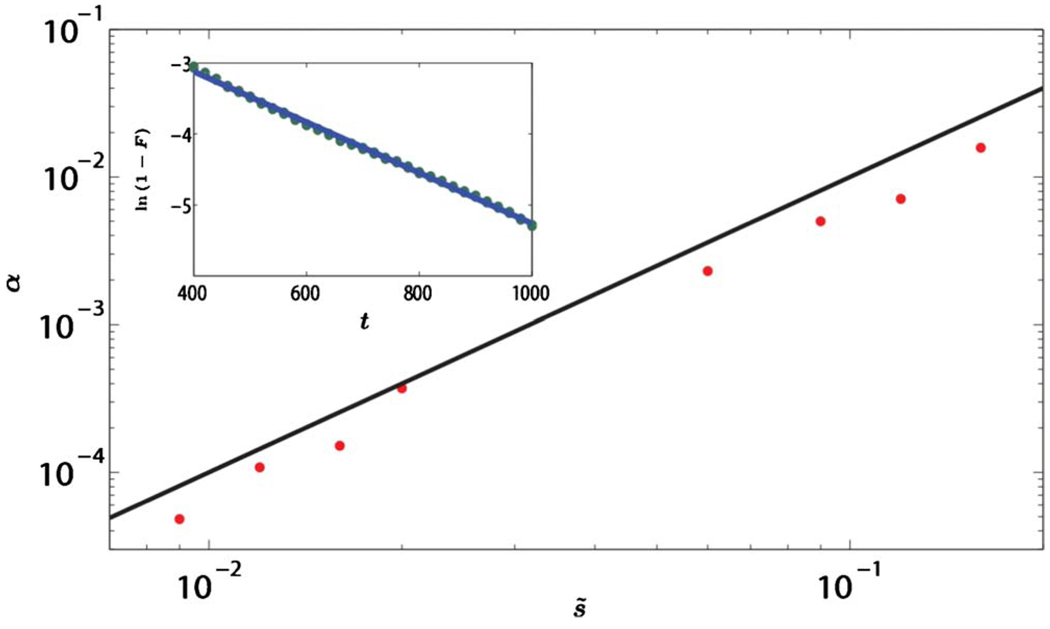
FIG. 13.
(Color online) The effective extinction rate α vs s̃ in the limit of weak selection. The dots are the data from the simulation and the black line has the slope equal to 2, which is the expected slope from Eq. (58). The data support α∝s̃2. The values of α are obtained from graphs like the one shown in the inset. Inset: ln(1−f) vs t for s̃=0.12. The circles are the actual data points and the line is the best least-squares linear fit. The simulation confirms exponentially fast fixation. The data are obtained in a simulation of 1600 individuals for 6000 generations with averaging over 100 realizations. At t=0, each site is assigned either allele one or allele two with equal probability.

