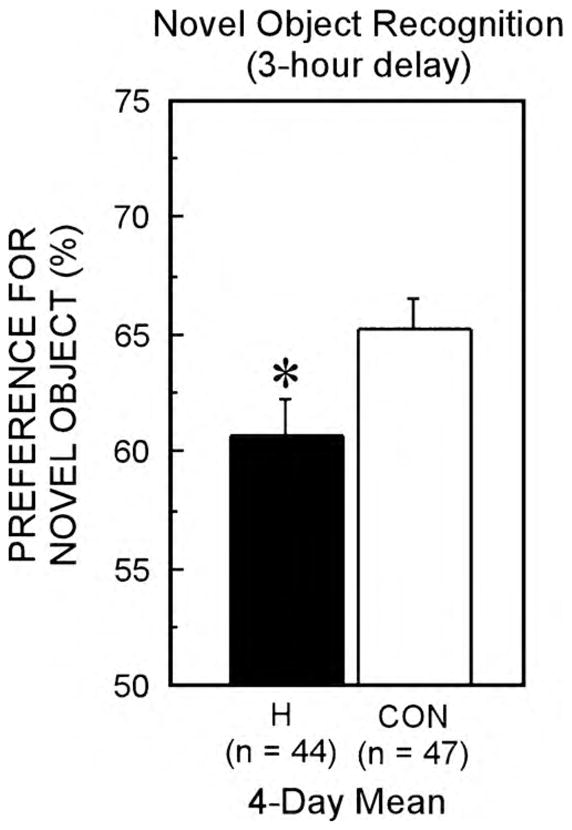
Fig. 4.

Performance on the NOR task on 4 different days. On each day there was a familiarization and test phase by sham operated animals (CON, n = 47) and animals with hippocampal lesions (H, n = 44). Performance was scored over 30 s of cumulative object exploration. The figure shows the 4-day mean for the hippocampal lesion group (black bar) and the sham group (white bar). Both groups performed above chance (chance = 50%). Group difference is indicated by an asterisk (p < 0.05).
