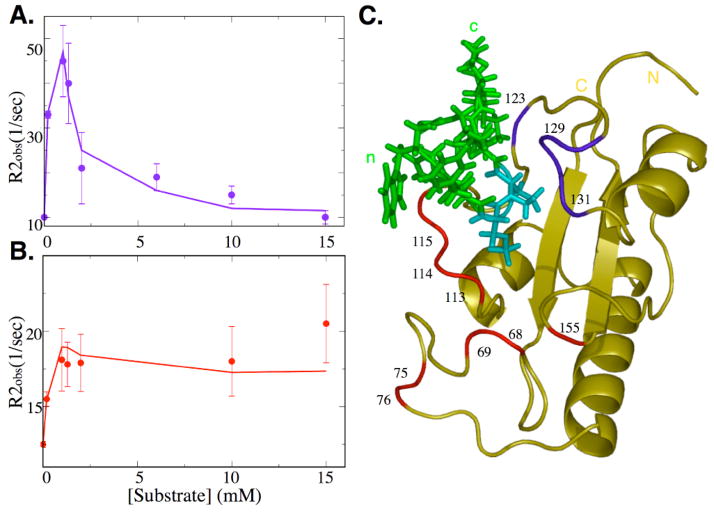
Figure 3.
Conformational exchange of Pin1cat during catalysis. Transverse relaxation rates (R2obs) of Pin1cat were measured as a function of substrate concentration. Two distinct trends can be clearly observed: (A) The contribution to R2obs from conformational exchange reaches a maximum as the substrate concentration approaches the dissociation constant before diminishing close to zero in the saturated enzyme. Probes describing this trend are shown in blue in the complex structure (C).; the curve shows the individual measurements for Gly128 (A). (B) A second set of probes has a maxium conformational exchange contribution as the enzyme is saturated with substrate peptide, shown in red in (C). The curve shows the measurements corresponding to Gly155. Curves in A and B were fit by explicit numerical simulation of Bloch-McConnell equations[44] of magnetization evolution of a 3-state model (see Fig. 1C) using kex as calculated from CPMG experiments and Kd as calculated from the substrate titration (see text).

