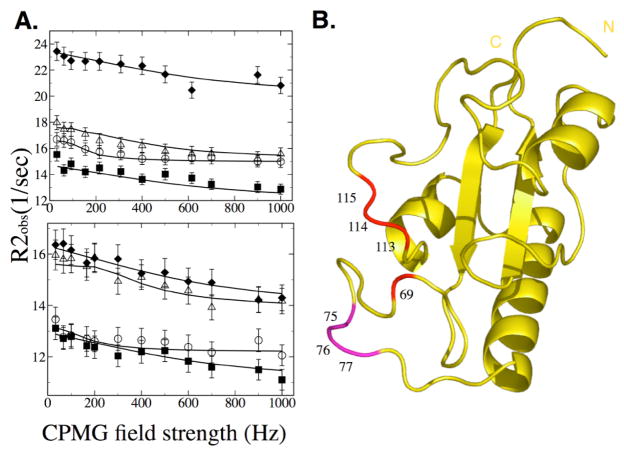
Figure 5.
(A) Quantitative analysis of exchange dynamics in free Pin1cat measured at 14.1T (Top) and 11.7T (Bottom). Residues in Groups A and B can be globally fit to a 2-site model with an exchange rate of 1700 +/− 500 sec−1 and a rate of 3500 +/− 1500 sec−1 at 25°C, respectively. Plots are shown for residues Arg69 (○), Ser114 (△, Gln75 (■) and Lys77 (◆). (B) Residues in group A are highlighted in red while those in Group B are highlighted in purple. These dynamic regions of the free enzyme are a subset of the dynamic regions observed in the active complex (Fig. 4).

