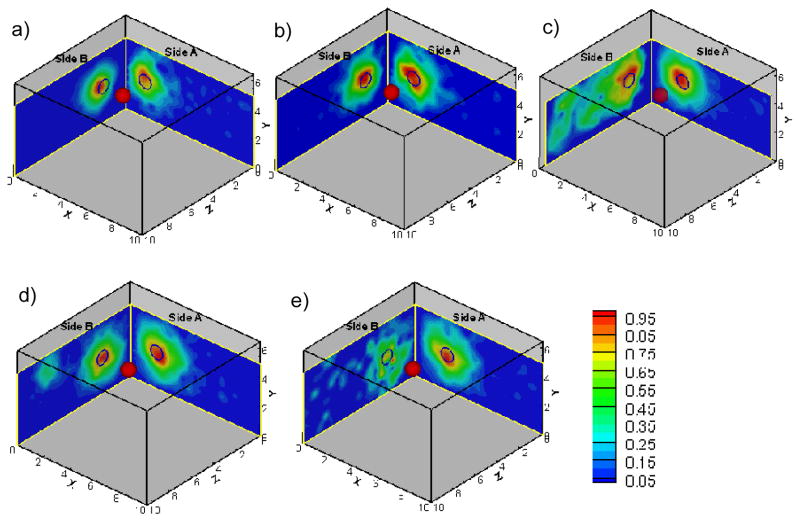
Fig. 2.
The 2-sided surface contour plots of fluorescence amplitude obtained from frequency-domain multi-projection imaging studies for all experimental cases (figure (a) to (e) corresponding to case 1 to 5). The projected 2-D target location is shown as black hollow circles on Sides A and B of the phantom. The solid red sphere in the phantom represents the true 3-D target location. Each surface contour plot was normalized with respect to the maximum amplitude in that particular scan at a given probe location.

