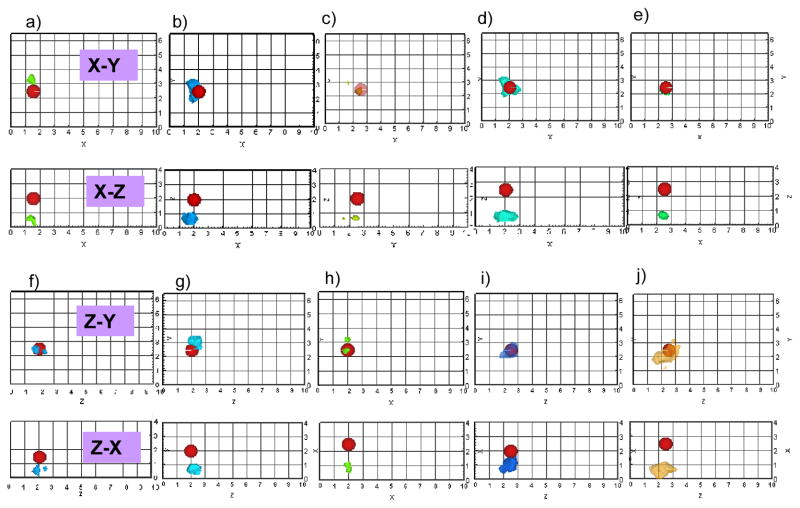
Fig. 3.
Iso-surface contour plots of the 3-D image reconstructions based on single-projection measurements presented in the X-Y and X-Z plane for Side A measurement based reconstructions, Z-Y and Z-X planes for Side B measurement based reconstructions, using 1% Liposyn phantom under perfect uptake conditions for Study I. Tomography studies performed using single-projection based measurements at Side A of phantom (X-Y plane) was shown in (a) to (e) for experimental cases 1 to 5, respectively. Tomography studies performed using single-projection based measurements at Side B of phantom (Z-Y plane) was shown in (f) to (j) for experimental cases 1 to 5, respectively. A single 0.45 cc target was located at [1.5, 2.5, 2] cm in (a) and (f), [2, 2.5, 2] in (b) and (g), [2.5, 2.5, 2] in (c) and (h), [2, 2.5, 2.5] in (d) and (i), and [2.5, 2.5, 2.5] in (e) and (j). The solid sphere in each plot represents the true target location and the irregular solid region represents the reconstructed target location. A cut-off value (selected based on the first break point of histogram plot of μaxf) was applied to iso-surface contour plots in order to differentiate the target from the background. Only 4 cm along the depth is presented in the plot, although the total depth for Side A is Z=10 cm and for Side B is X=10cm.

