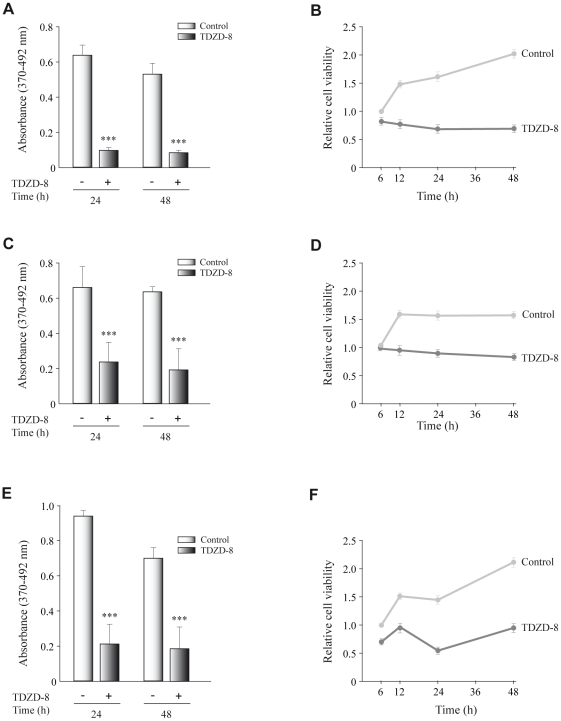
Figure 3. Effect of TDZD-8 treatment on cell proliferation and survival in different glioblastoma cell lines.
GL261 (A, B), A172 (C, D) and U373 (E, F). (A, C, E) Proliferation rates determined by a BrdU incorporation assay. Tumoral cells were seeded into individual wells of a 96-well plate and cultivated for 24 and 48 h in the presence or absence of TDZD-8 after which BrdU was added to the culture medium. Cells were harvested 16 h after BrdU addition. Indicated are the means ± SD measured. (B, D, F) Cells were seeded in a 96-well plate and at different times after plating cell viability was determined by the MTT assay, as indicated in Materials and Methods. Values are the means ± SD of at least three different experiments.

