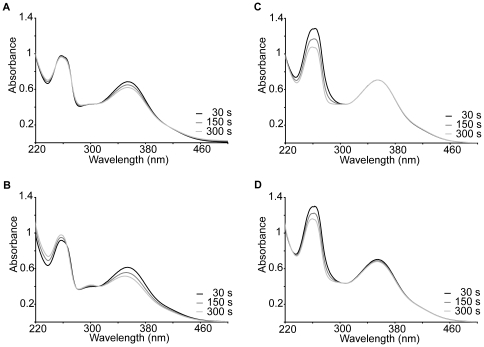
Figure 1. Spectrophotometrical analyses.
Spectrophotometrical analysis of the incubation mixture containing (A) 50 µM monoHER, 1.6 nM horseradish peroxidase (HRP) and 33 µM H2O2. The same experiment was carried out in (B) the presence of 40 µM GSH, (C) 40 µM ascorbate and (D) both 40 µM GSH and 40 µM ascorbate. The UV/Vis scans were recorded 30, 150 and 300 seconds after the addition of HRP. A typical example is shown.

