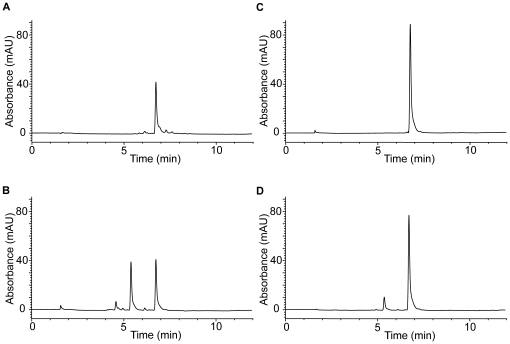
Figure 2. HPLC analyses.
HPLC analysis of the incubation mixture containing (A) 50 µM monoHER, 1.6 nM horseradish peroxidase (HRP) and 33 µM H2O2. The same experiment was carried out in (B) the presence of 40 µM GSH, (C) 40 µM ascorbate and (D) both 40 µM GSH and 40 µM ascorbate. The different incubation mixtures were injected on the HPLC system 5 minutes after the addition of HRP. A typical example is shown. The retention time of monoHER is 6.7 min and that of 2′-GSH-monoHER is 5.4 min. The initial peak height of monoHER before oxidation was 88 mAU, corresponding to a concentration of 50 µM. After 5 min of oxidation the monoHER concentrations in the incubation mixtures A, B, C and D were 22.5 µM, 22.5 µM, 50 µM and 43.5 µM, respectively.

