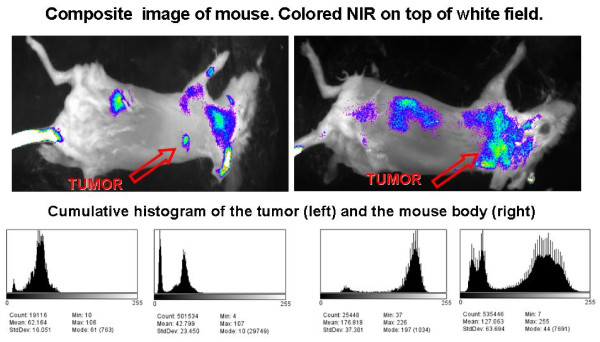
Figure 3.
Composite images (white field image superimposed with the fluorescence intensity), and cumulative histograms for the tumor region and the whole body of two mice (A and B) injected with 2C5 QD-Mic. Fluorescence is concentrated mainly in the tumor area, and the cumulative histograms of the frequency of pixels vs. their value for the tumor area and the body of the animal verify that the region of interest (tumor area) has a narrow distribution of the highest value pixels from the animal body.

