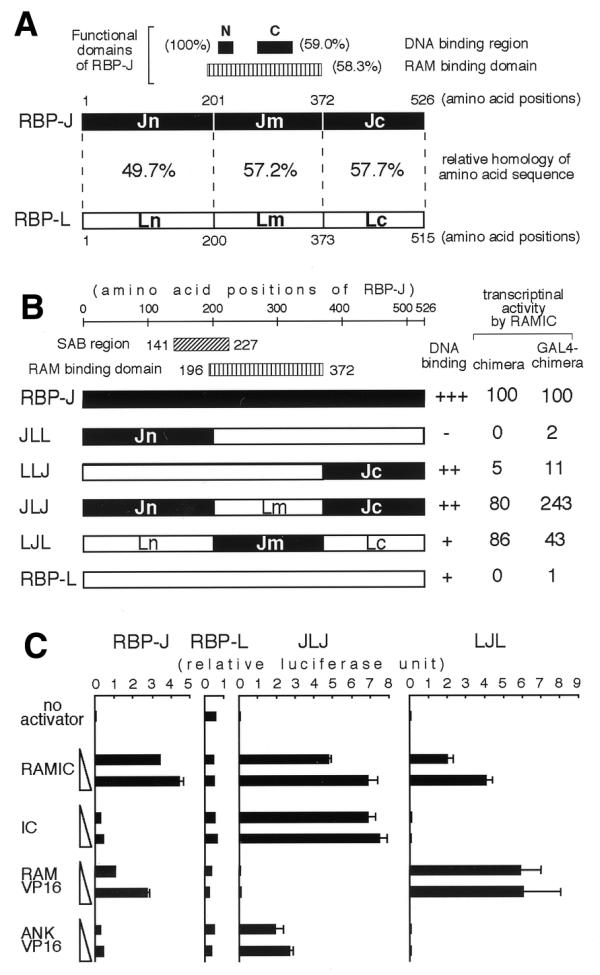
Figure 4.

(A) A schematic comparison of amino acid sequences of RBP-J and RBP-L. Closed boxes represent DNA binding regions of RBP-J with the designations N (amino acids 212–227) and C (amino acids 275–323) (16,31). A vertically hatched box represents the RAM binding domain (amino acids 196–372) of RBP-J (16). The regions Jn, Jm and Jc are explained in the text: Ln, Lm and Lc are the corresponding regions in RBP-L. The percentage of each region represents the relative amino acid sequence homology between RBP-J and RBP-L. (B) Transcriptional activities of chimeras of RBP-J and RBP-L. Components from RBP-J and RBP-L are displayed as black and white bars, respectively. The numbers of amino acids correspond to their positions on RBP-J. RAMIC-dependent transcriptional activities of chimeras and GAL4-chimera fusions were evaluated by the same approach as shown in Figure 1 and are represented as relative to RBP-J and GAL4–RBP-J, respectively. (C) The transcriptional activities of chimeras by increasing amounts of activators are demonstrated. Aliquots of 10 ng of pCMX RBP-J, RBP-L or chimeras were constantly introduced into a well of OT11 cells with 0.5 µg of pGa981-6, 0.25 µg of pCMXlacZ and 0.25 or 1.0 µg of activators in pEFBOSneo. The scales of relative luciferase units in RBP-J, RBP-L, JLJ and LJL are equal to each other.
