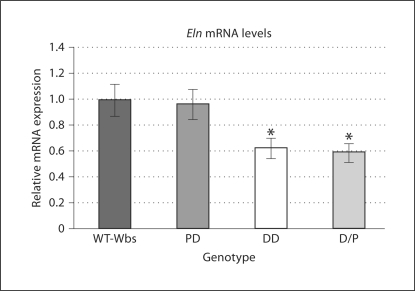
Fig. 1.
Relative Eln transcript levels in p7 mice from each Wbs genotype. The data have been normalized such that the mean of the WT-Wbs group is 1.0 ± 0.12. Eln transcripts in DD and D/P mice are significantly reduced compared to combined WT-Wbs and PD levels (n = 3–5 per group; * p < 0.03). Means ± SE.

