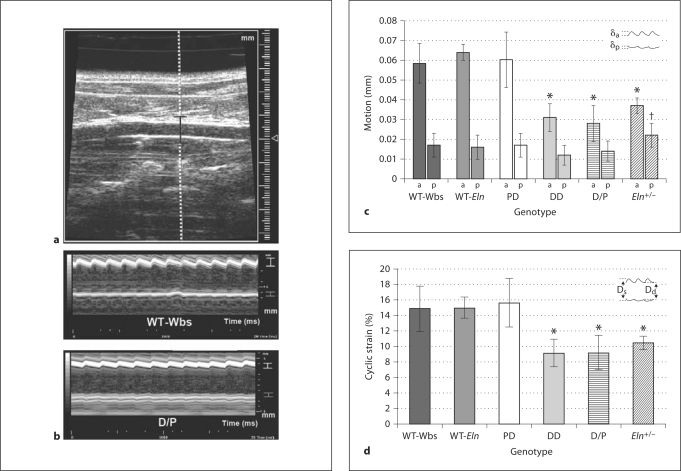
Fig. 3.
a Anteroposterior projection B-mode ultrasound image of the abdominal aorta. One trajectory from the image is selected (dotted line) through a selected depth (black bracket) to track aortic motion. b M-mode image highlighting anterior wall motion (white bracket) and posterior wall motion (gray bracket) in both WT-Wbs and D/P mice. c Anterior (a) and posterior (p) aortic wall motion with schematic showing distances defined δa and δp. DD, D/P, and Eln+/– mice all showed significantly reduced anterior wall motion compared to wild-type littermates (* p < 0.001). Interestingly, Eln+/– mice had significantly greater posterior wall motion than DD and D/P mice († p < 0.05). d Circumferential cyclic Green-Lagrange strain with schematic of aortic motion showing maximum systolic (Ds) and minimum diastolic (Dd) diameters. Strain in DD, D/P, and Eln+/– mice were significantly reduced compared to wild-type littermates (* p < 0.001). Means ± SD.

