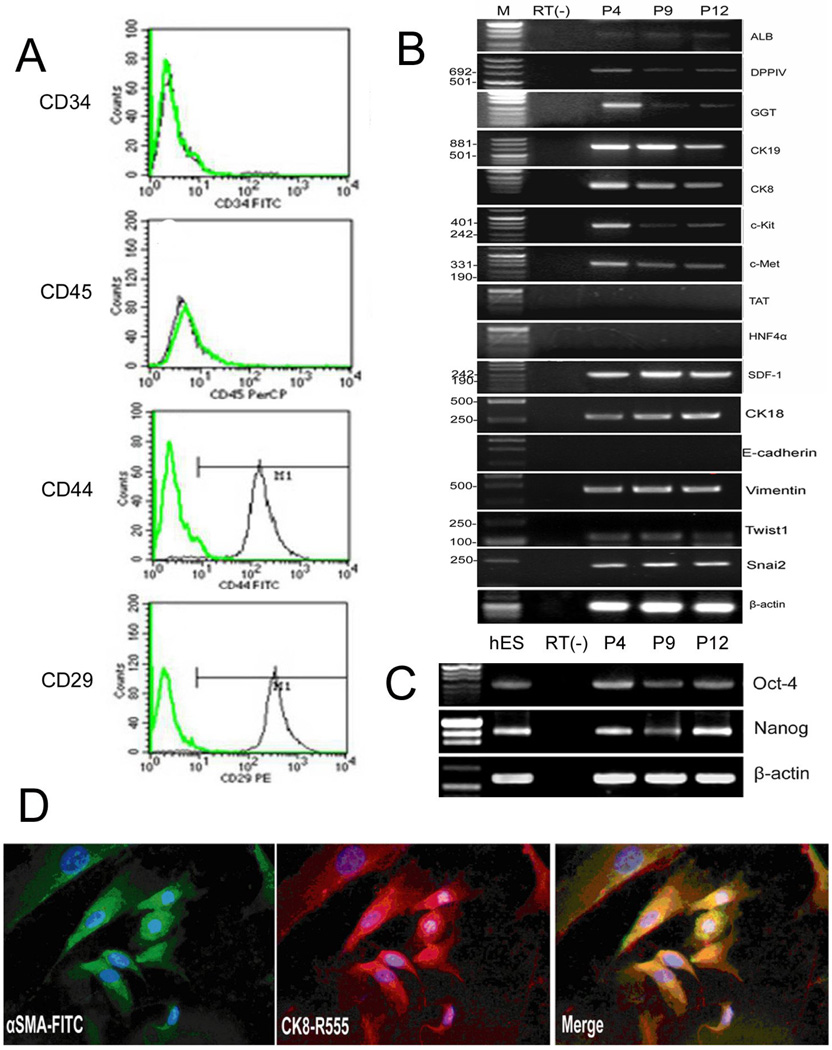
Fig. 3. Gene expression profile of hLBSC.
RT-PCR analysis show that hLBSC express most markers characteristic for hepatic progenitor cells, such as ALB, DPPIV, GGT, CK19, CK8, CK18, c-Kit, and c-Met, but no expression of E-cadherin, TAT and HNF4α (B). hLBSC also display some characteristics of mesenchymal cells, such as CD44, CD29 (A), vimentin, Twist1, Snai2 and SDF-1 (B), together with expression of Oct4 and nanog (C). But no hematopoietic markers CD45 and CD34 (A) were detected by FACS. Double immunofluorescence using the anti-αSMA polyclonal antibody and anti–CK8 monoclonal antibody reveal co-expression of CK8 (red) and aSMA (green) in hLBSC, with DAPI (blue) nuclear counterstaining (D). Plots in A show isotype control IgG-staining profile (green line) versus specific antibody staining profile (black line). P4, P9, P12 represents hLBSC in 4, 9, 12 passages (B, C). M: pUC Mix Marker or D2000. RT (−): mRNA sample without reverse transcription.

