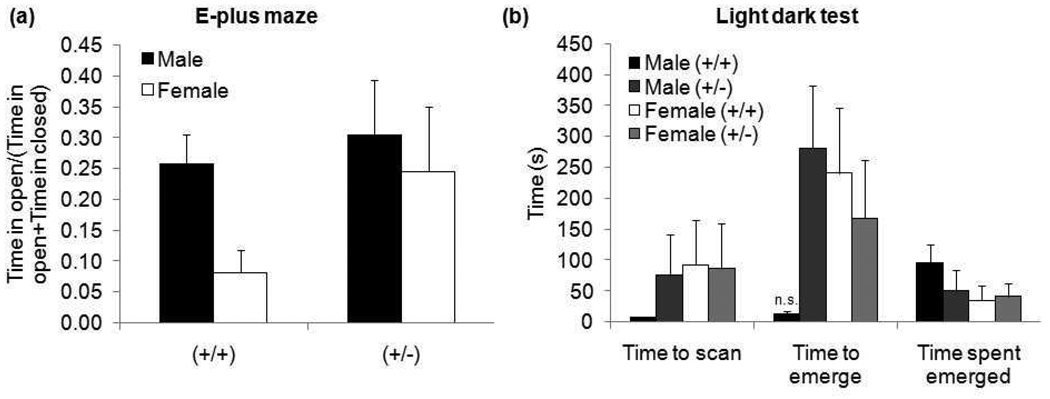
Figure 6. Results from (a) EPM and (b) LDT.
EPM data is presented as a ratio of time spent in the open arm to total time spent in all arms to correct for differences in locomotion. There were no significant differences between groups. LDT testing showed a near-significant trend with (+/+) males fully emerging more quickly than other groups. There were no significant differences in the other measures. (n.s. p=0.056)

