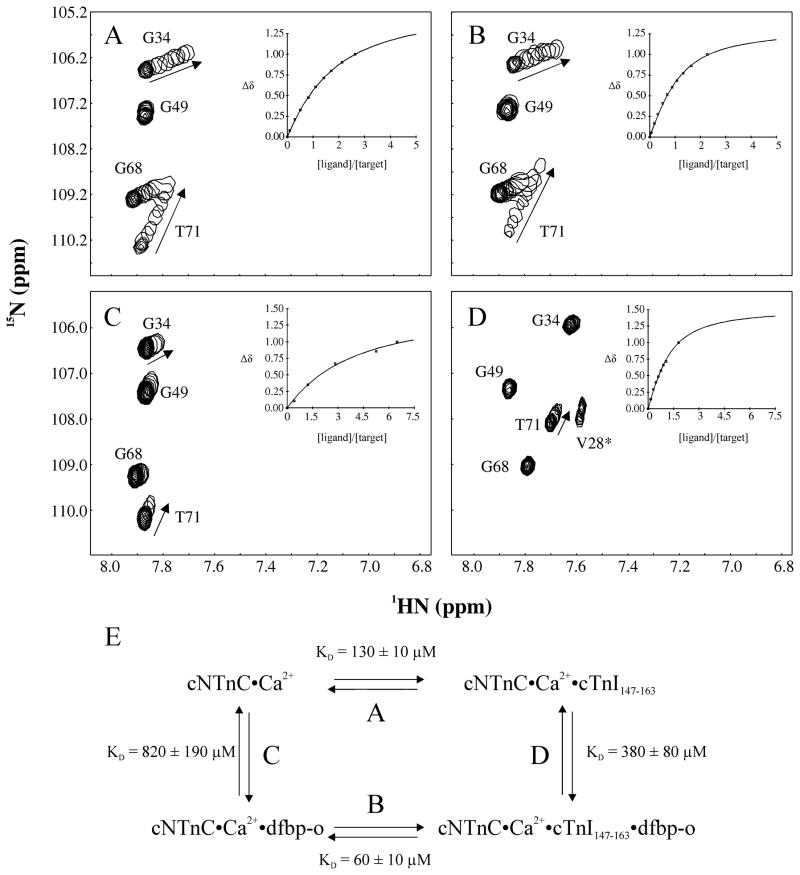
Figure 2.
(A) Titration of cTnI147–163 into cNTnC. (B) Titration of cTnI147–163 into cNTnC•dfbp-o (4 fold excess of dfbp-o). (C) Titration of dfbp-o into cNTnC. (D) Titration of dfbp-o into cNTnC•cTnI147–163 (2–3 fold excess of cTnI147–163). The same expanded region of the two dimensional 1H,15N- HSQC NMR spectra of cNTnC for each ligand is shown. Spectra taken at the various titration points are superimposed. Arrows indicate the direction of chemical shift perturbation induced by the ligand. V28 is present in the spectrum (D) but not narrow enough to be seen in the other spectra. (E) The thermodynamic cycle of dfbp-o and cTnI147–163 binding to cNTnC.

