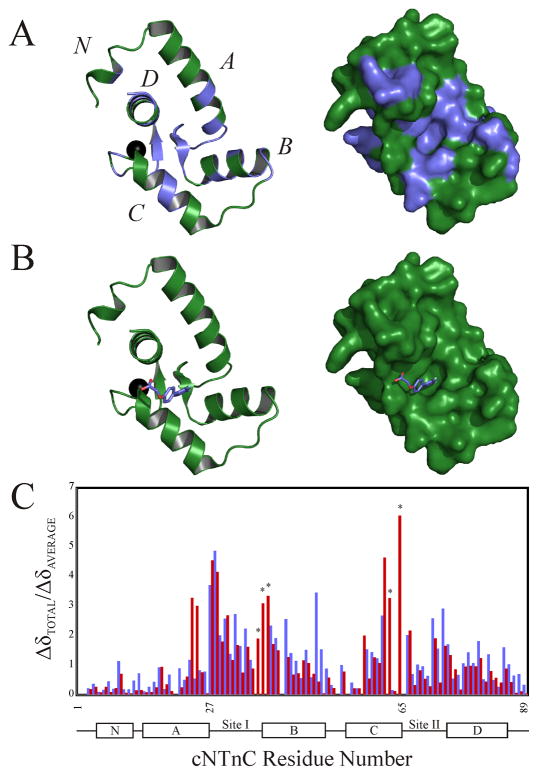
Figure 4.
(A) Mapping of the chemical shifts induced by the binding of dfbp-o to cNTnC onto the cartoon (left) and surface (right) representations of cNTnC taken from the cTnC•3Bep structure (1dtl.pdb). All residues perturbed more than the average chemical shift change are colored in slate, with the unperturbed residues colored in green; the Ca2+ is shown as a black sphere. (B) Localization of the binding site of dfbp-o on cNTnC by AutoDock 4.0. The lowest energy binding mode of dfbp-o (stick representation) is shown docked onto the cartoon (left) and surface (right) representations of cNTnC. (C) Bar diagram plotting the relative chemical shift perturbations of cNTnC induced by cTnI147–163 (red bars) or dfbp-o (slate bars). Residues marked with a star were exchange broadened during the dfbp-o titration, and therefore final perturbed distances were not measured.

