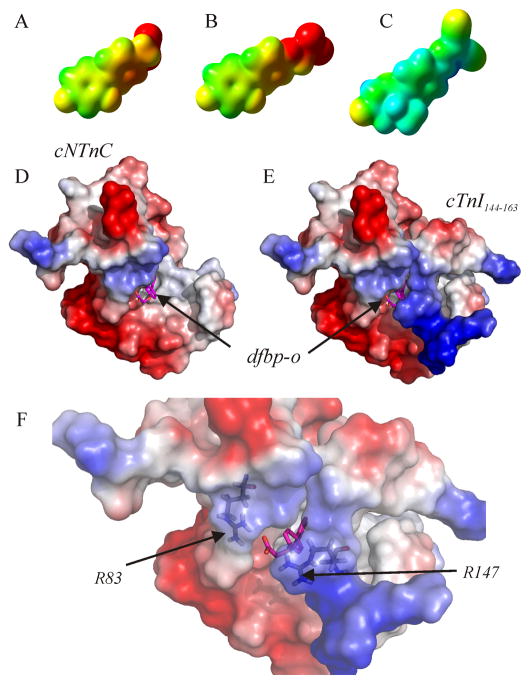
Figure 7.
The electron density isosurfaces of (A) dfbp, (B) dfbp-o, and (C) levosimendan calculated using the quantum chemistry program Gaussian03. The compounds are positioned so that the fluorine atoms of dfbp and dfbp-o are in a similar orientation as the methyl and carbonyl oxygen groups of levosimendan as in figure 1. The mapped electrostatic potential is colored on the isosurfaces (negative – red, positive – blue, neutral – green). Electrostatic surface representation of the structure of cNTnC•cTnI144–163•dfbp-o. (D) cTnI144–163 has been omitted from the structure to indicate the location of dfbp-o. (E) Full ternary complex. (F) Close-up view of the electrostatic environment surrounding the carboxyl group of dfbp-o with Arg83 and Arg147 labeled. The electrostatic potential is shown on the surface of cNTnC and cTnI144–163 as a color gradient from negatively charged (red) to positively charged (blue). Dfbp-o is shown in stick representation, with carbon atoms in magenta, oxygen in red, and fluorine in aqua.

