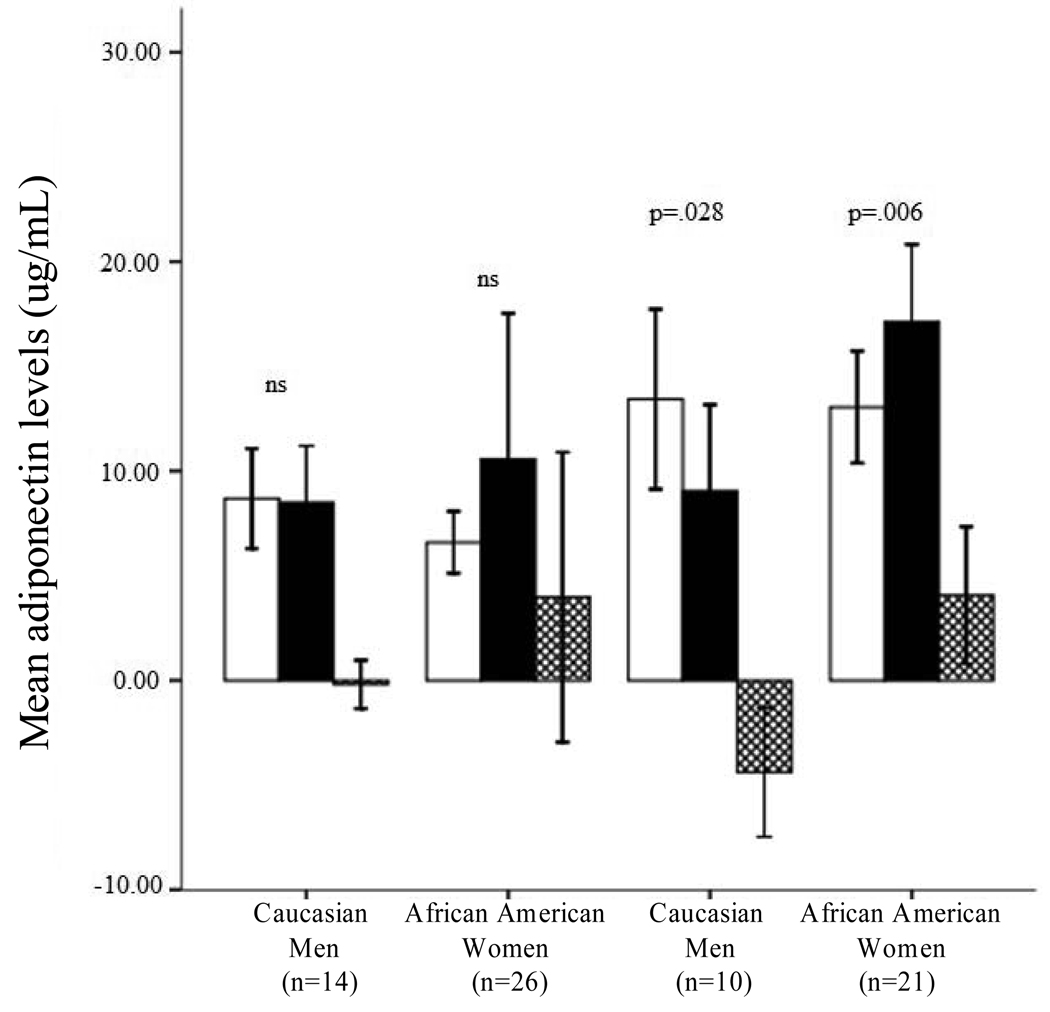
Figure 1. Adiponectin levels among sleep restricted participants.
Mean adiponectin levels at baseline (B2,  ) and following sleep restriction (SR5,
  ). Change in adiponectin levels (SR5 minus B2,
  is also presented. Significant differences between B2 and SR5 indicated with p-values. Data from control condition not presented; Wilcoxon signed rank tests conducted. Error bars are +/−2 SE of mean.

