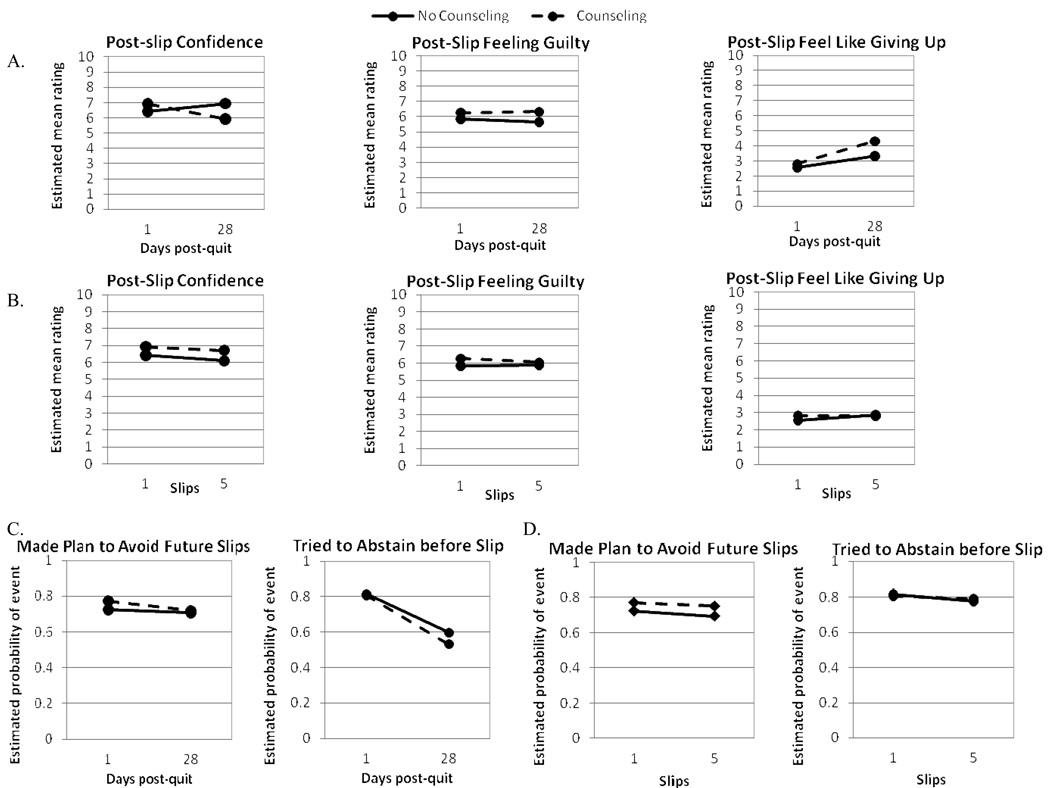
Figure 5.
Estimate means or probabilities of slip report responses as a function of counseling condition (no counseling shown by solid lines, counseling shown by dashed lines). Panels A and B depict mean ratings of confidence related to quitting, feelings of guilt about slipping, and feeling like giving up after a slip as a function of days from the quit day and the number of slips reported, respectively. Panels C and D depict the probability of attempting to abstain prior to a lapse and of making plans to avoid future slips following a lapse as a function of days post-quit and number of slips, respectively.

