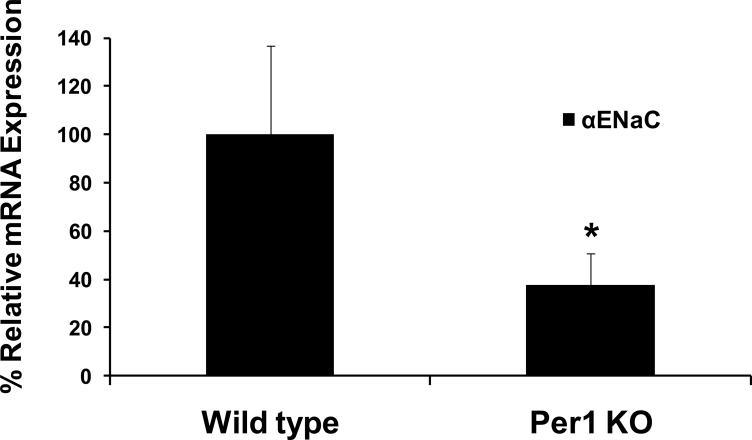
Figure 1. αENaC mRNA expression is reduced in the renal cortex of Per1 knockout mice.
Total RNA was isolated from the renal cortex of wild type (129/sv) or Per1 knockout mice. QPCR was used to analyze changes in gene expression of αENaC in Per1 deficient animals. Fold change values were normalized against actin and relative to wild type control mice. Data are presented as the mean ± standard error, n=5 *p<0.05

