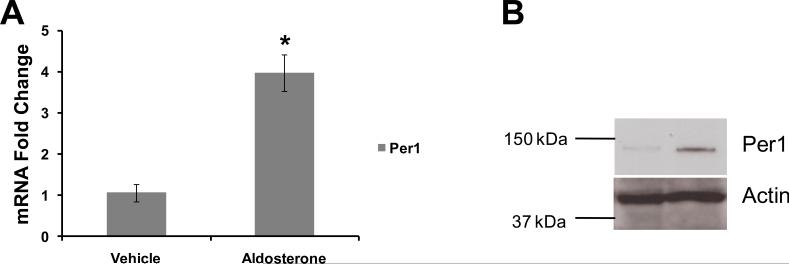
Figure 2. Per1 is induced by aldosterone in mpkCCDc14 cells.
A. mpkCCDc14 cells were treated with vehicle (ethanol) or aldosterone (1 μM) for 24 hr. Quantitative real time RT-PCR (QPCR) was used to measure changes in gene expression. Fold change values were calculated relative to actin and compared to vehicle treated control cells. Data are presented as the mean, ± standard error, n=at least five independent experiments. *p<0.05 versus vehicle. B. mpkCCDc14 cells were treated with vehicle or 1 μM aldosterone for 24 hr. Total cell lysates were collected and analyzed via Western blot using an anti-Per1 antibody (Affinity Bioreagents). An anti-actin antibody (Sigma) was used for a loading control. Data are representative of three independent experiments.

