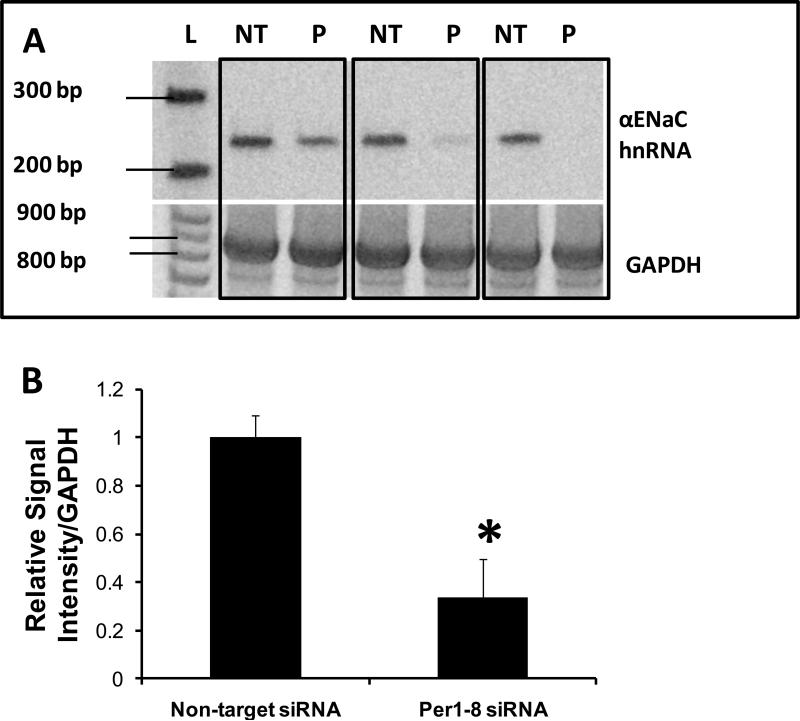
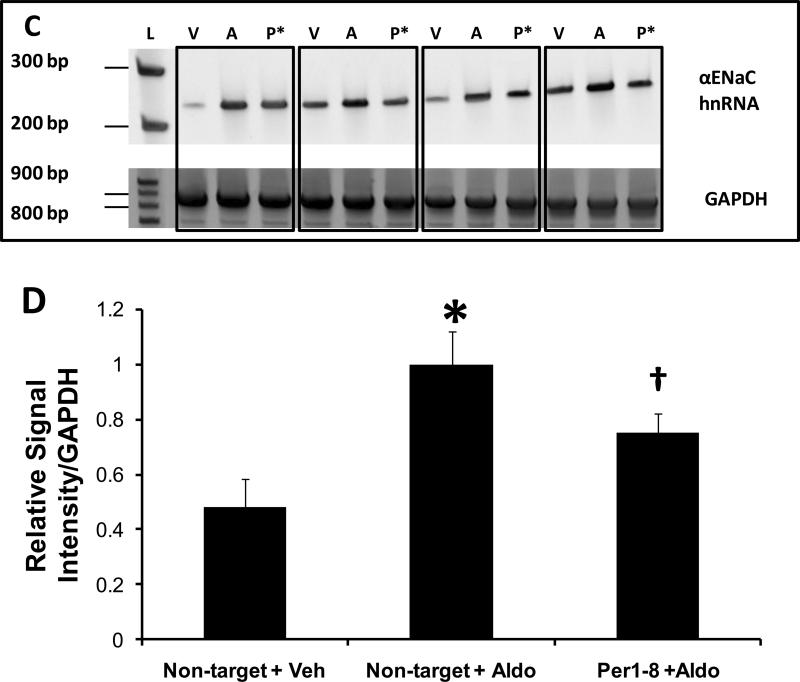
Figure 6. Per1 knockdown Inhibits αENaC transcription in mpkCCDc14 cells.
A. Top panel: Primers were designed to amplify a 238 bp region of the αENaC gene between exon 8 and intron 8 in order to measure heterogeneous nuclear RNA as an indicator of transcriptional activity. Templates from non-target siRNA or Per1–8 siRNA transfected mpkCCDc14 cells were used in PCR reactions, n=3. L: ladder, NT: non-target siRNA, P: Per1–8 siRNA. Bottom panel: An 874 bp GAPDH product was amplified as a PCR control. Boxed samples represent independent experiments. B. Densitometry analysis was performed on the gel images in panel A and is presented as signal intensity relative to GAPDH. * p<0.05 versus non-target siRNA. C. The same experiment was performed as described for (A) but mpkCCDc14 cells were treated with vehicle or aldosterone for 24 hr following siRNA transfection. L: ladder, V: non-target siRNA +vehicle, A: non-target siRNA +aldosterone, P*: Per1–8 siRNA plus aldosterone. N=3 D. Densitometry analysis was performed as described for Panel B. * p<0.05 versus non-target siRNA + vehicle; † p<0.05 versus non-target siRNA +aldosterone.


