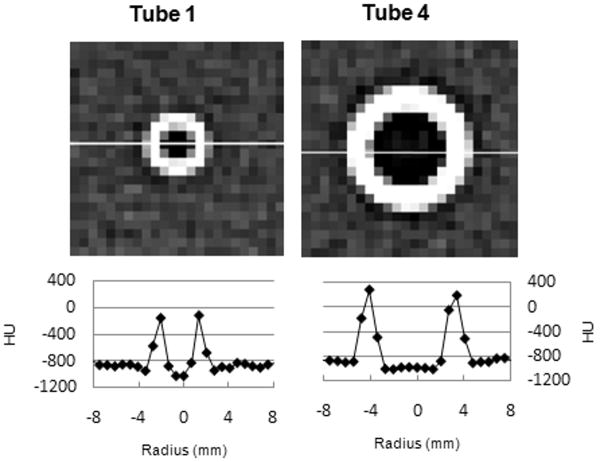
Fig. 2.
The CT images of Tubes 1 and 4 and the graphs below the images were obtained using the public-domain program ImageJ. The graphs show the attenuation (in HU) along the line crossing the tube plotted as a function of distance. The maximum HU value of Tube 1 is much less than the airway tube attenuation, so the half-maximum point is near -700 HU. This will result in a calculated wall thickness that is too large.

