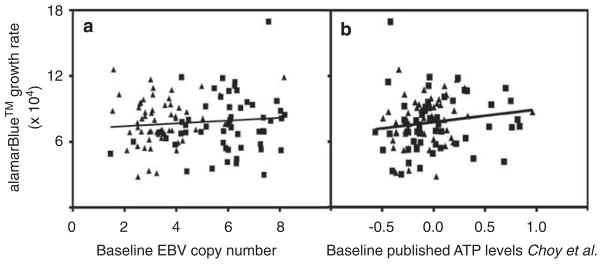
Figure 2.
Correlation between growth rate and baseline EBV copy number. (a) Shows growth rate estimates calculated from alamarBlue growth inhibition assay correlated against baseline EBV copy number in 107 unrelated HapMap lymphoblastoid cell lines. The correlation (r2=0.00969) is not significant (P=0.30). (b) Uses the same growth rate estimates to show no significant relationship with baseline ATP levels as measured in Choy et al.20

