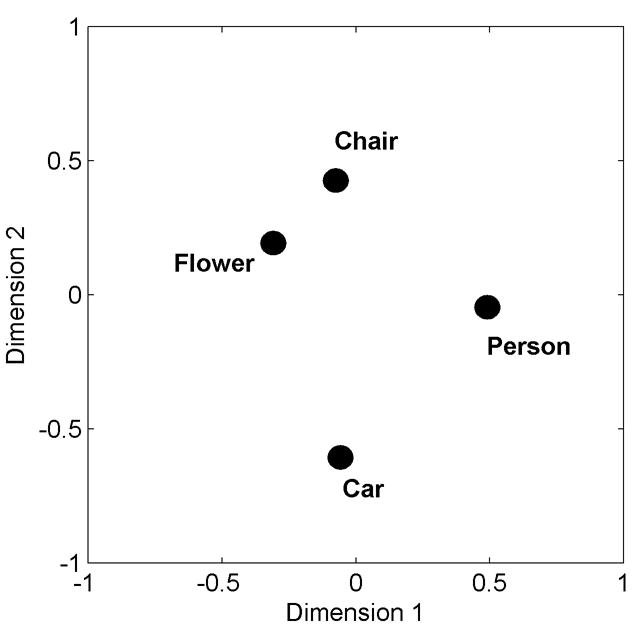
Figure 4.

The two-dimensional centroid map derived from the eight individual similarity maps. The correlation of the individual maps with the centroid map equaled: .70 for 8B, .80 for 66Y, 0.82 for 72Y, 0.86 for 80Y, 0.87 for 33B, 0.55 for 66W, 0.86 for 75B, and .68 for 93W.
