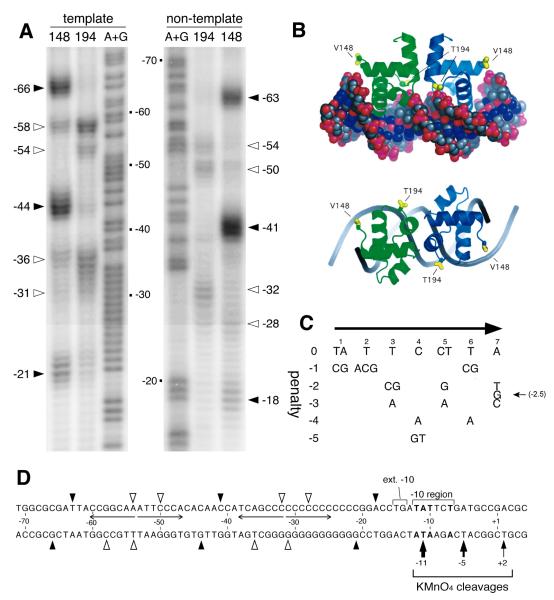
Fig. 2. BvgA-FeBABE cleavage of fim3 promoter DNA.
A) Patterns resulting from cleavage by BvgA-FeBABE of DNA fragments containing the fim3 promoter. BvgA was derivatized with FeBABE at a cysteine residue, introduced by site-directed mutagenesis into the gene encoding BvgA C93A C103A, at either position 148, corresponding to the outer boundaries of a BvgA dimer, or at position 194, corresponding to the dimer interface (see Fig. 2B). Pfim3 promoter fragments were 32P-labeled at the 5′ end of the template strand (left) or the 3′ end of the non-template strand (right) as previously described (Boucher et al., 2003). The same fragments were used in the A+G sequencing reaction described by Maxam and Gilbert (1977) to allow determination of cleavage coordinates, numbered relative to the start of transcription. Closed and open arrowheads indicate the positions of maximum cleavage, for each FeBABE moiety, by BvgA derivatized with FeBABE at position 148, and 194, respectively. B) Predicted structure of the BvgA C-terminal domain bound to DNA, derived by modeling of the BvgA protein sequence on the crystal structure of the homologous NarL C-terminal domain bound to its operator site (Maris et al., 2002). Positions of the V148 and T194 residues substituted with cysteine for the purpose of FeBABE-labeling are indicated. Side and top views are provided. Figure from Boucher et al. (2003). C) Table representing an algorithm for assessing functionality of DNA sequences bound by BvgA. Overall penalty scores for a given seven bp sequence are derived by summing the individual penalty scores at each position. These penalty scores were derived from data collected through systematic mutagenesis of the primary binding site of the fha promoter (Boucher et al., 2001a). Original figure from Merkel et al. (2003). An optimal sequence, such as the fha primary binding site, scores 0 for both half sites. More negative scores indicate lower predicted affinity for BvgA~P. D) Schematic illustration of the positions of cleavage of each strand of fim3 promoter DNA by BvgA-FeBABE-V148 (filled arrow heads) and by BvgA-FeBABE-T194 (open arrow heads), as shown in panel A. Nucleotide coordinates are given relative to the transcription start site. Nucleotides in bold type represent the transcriptional start site as well as those within the −10 region that match the consensus −10 sequence −12 TATAAT - 7. Also depicted are the sites of cleavage by KMnO4 of the template strand in a tertiary complex with BvgA~P and RNAP. Thickness of these arrows corresponds to intensity of cleavage, as shown in Fig. 3B.

