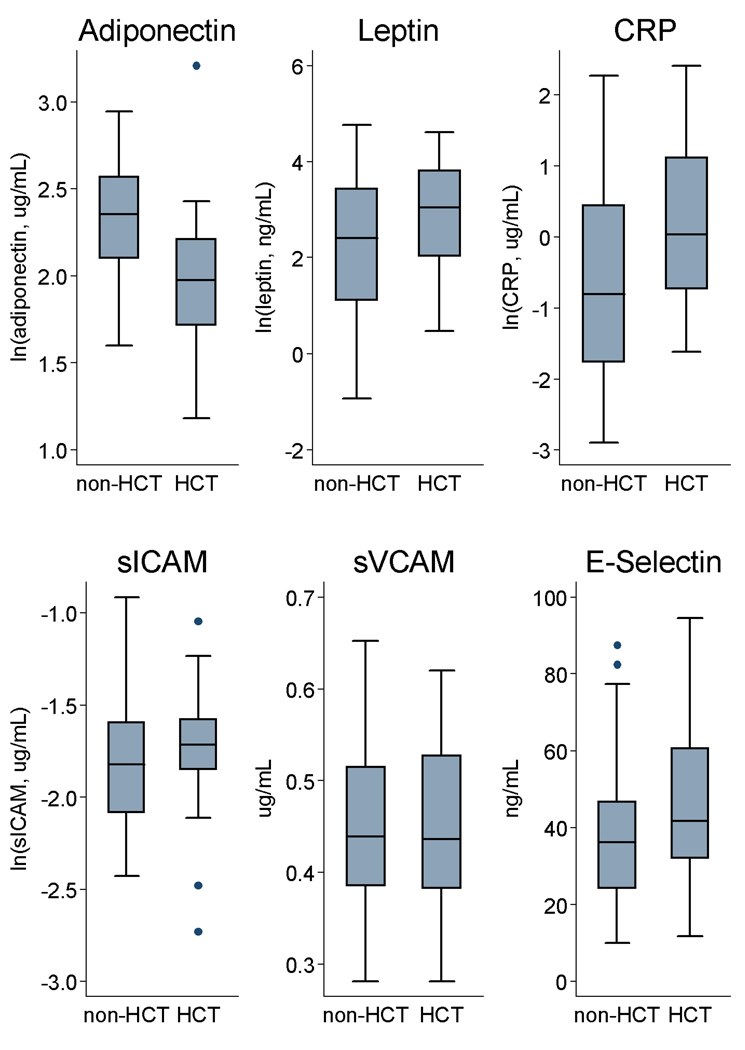
Figure 1.
Distribution of selected biomarkers stratified by hematopoietic cell transplantation (HCT) status: adiponectin, leptin, C-reactive protein (CRP), soluble intercellular and vascular cell adhesion molecules (sICAM, sVCAM) and E-selectin. Boxes show median values and interquartile ranges with whiskers denoting upper and lower adjacent values; outside values marked by closed circles. Differences between HCT and non-HCT survivors were significant for adiponectin and CRP (p<0.001 and p=0.02, respectively); distribution of other biomarkers were not significantly different in unadjusted analyses (leptin, p=0.08; sICAM, p=0.17; sVCAM, p=0.96; E-selectin, p=0.19).

