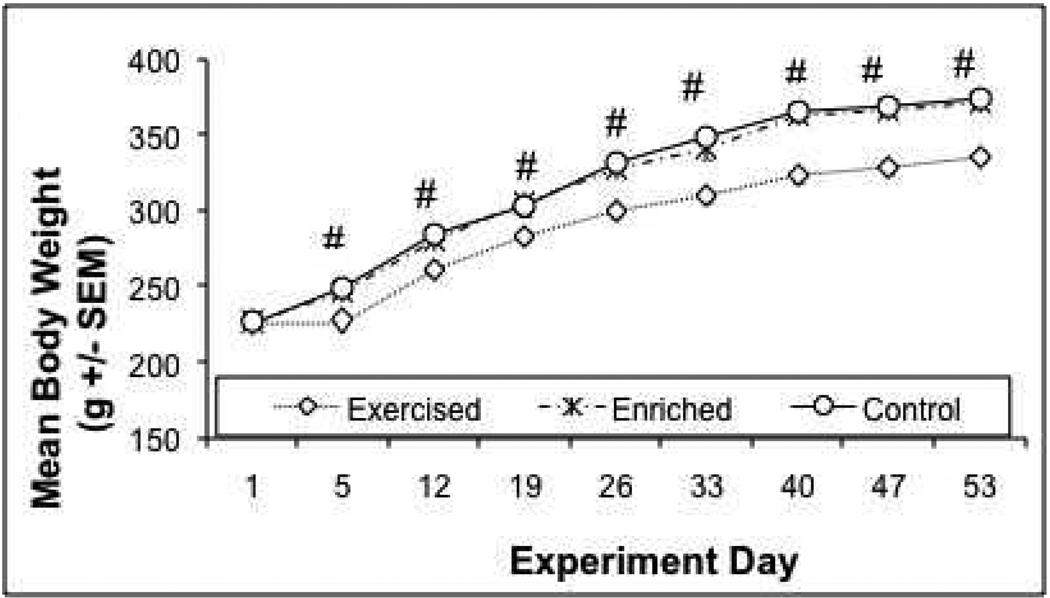
Figure 2. Mean Body Weight (g)+/− SEM Over Course of Experiment.
Animals were weighed on days 1, 5, 12, 19, 26, 33, 40, 47, and 53 of experiment (noise began on day 43). Body weights were equivalent between groups on day 1, but were significantly lower in exercised animals on day 5 and thereafter compared to the other two groups, which did not differ from one another. #: Exercise group significantly different from home cage control and increased cage complexity groups, Tukey's HSD (p's < 0.05).

