Figure 1.
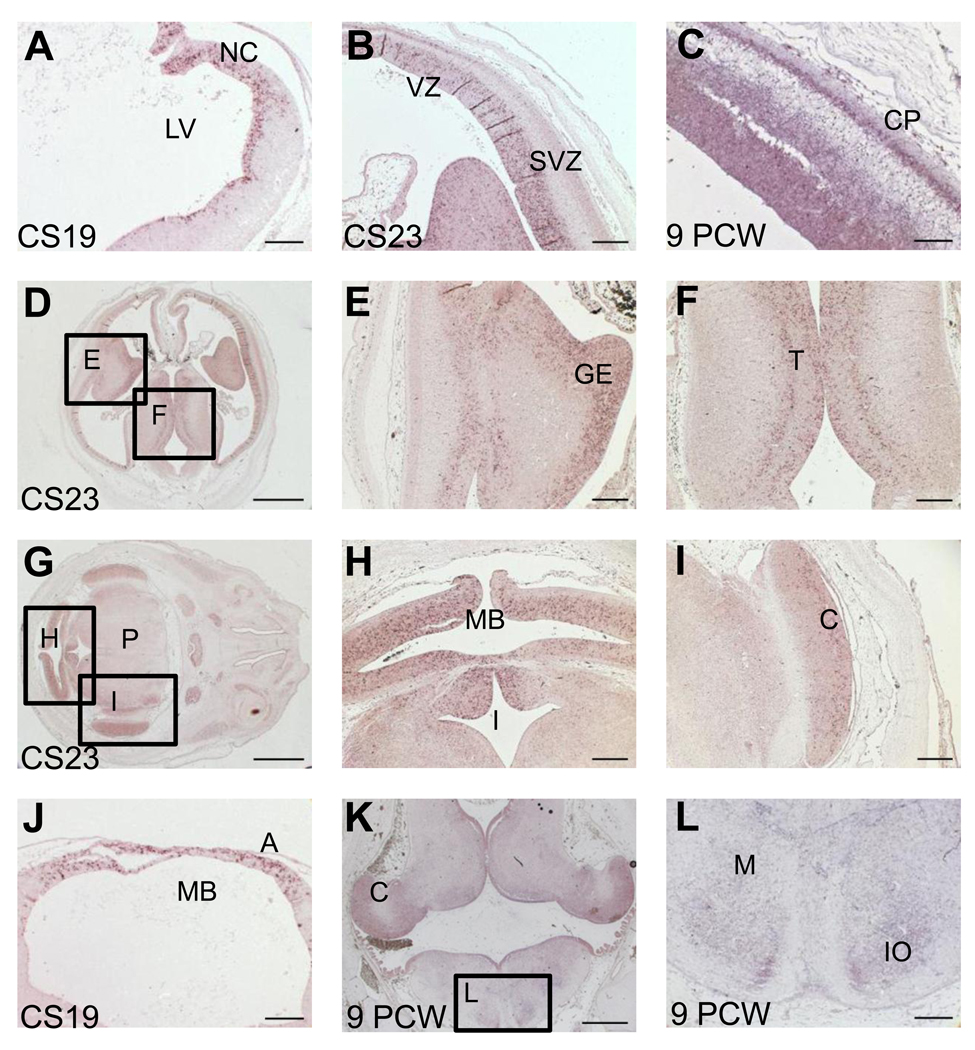
PLA2G6 expression in human brain at CS19, CS23 and 9 PCW. Panels A–L show images of in situ hybridization with antisense probes for PLA2G6 to sections at CS19 (A, J), CS23 (B, D–I) and 9PCW (C, K, L). Signal is detected as a purple stain. A)–C) PLA2G6 staining in developing neocortex. At CS19 (A), expression can be seen close to the lateral ventricle (VZ), by CS23 (B) expression is in the VZ and SVZ and by 9PCW (C) expression is also seen in the CP. D) Low magnification image showing developing neocortex, ganglionic eminences and thalamus. The boxed areas are shown at higher magnification in panels E and F. G) Low magnification image showing developing midbrain, isthmus, cerebellum and pons. The boxed areas are shown at higher magnification in panels H and I. J) PLA2G6 expression is seen in the alar plate of the developing midbrain. K) PLA2G6 expression in the hindbrain is seen in the developing cerebellum, the VZ of medulla and neurons in developing nuclei (IO). Boxed area is seen at higher magnification in panel L. No signal was detected using sense control probes (supplemental figure 1). C- cerebellum, CP- cortical plate; GE- ganglionic eminences, IO- inferior olive, I- isthmus, LV- lateral ventricle, M- medulla, MB- midbrain, NC- neocortex, P= pons, SVZ- subventricular zone, T- thalamus, VZ- ventricular zone. Scale bars are: 100µm in A,C,J,L; 200µm in B,E,F,H,I; 1000µm in D,G,K.

