FIG. 3.
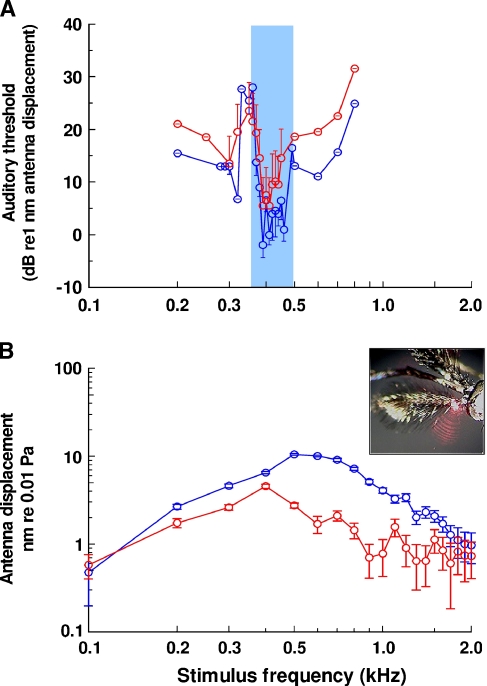
Auditory frequency tuning curves of Toxorhynchites brevipalpis. A Behavioral threshold tuning curves of males (blue) and females (red), expressed with respect to sound-evoked displacements of antennae. Data points: mean ± SD, n = 7 mosquitoes. The blue area indicates a frequency region where the criterion for detecting a change in wing-beat frequency was convergence of the wing-beat frequency with the stimulus tone. Tone frequencies outside this region elicited a transient increase in wing-beat frequency when the stimulus reached or exceeded detection threshold. Behavioral tuning curves were calibrated with respect to antennal displacement by relating stimulus strength to measurements taken with a laser-diode interferometer of displacement of base of the antennae by pure tones at 54 dB SPL (0.01 Pa) shown in B. Antennal displacements of 1 nm were generated by a 400–500 Hz, 30 dB SPL tone at a distance of 3 cm from the speaker. B Mechanical tuning curve measured with a laser-diode interferometer (Lukashkin et al. 2005) focused on base of the antenna (inset). Antennal displacements were measured with respect to measured vibrations of the pedicil, within which the antennae is located. Data points: mean ± SD, n = 5 mosquitoes (from Gibson and Russell 2006, with permission of the publisher).

