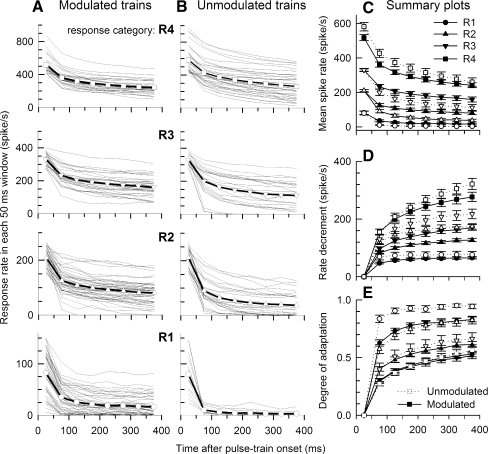
FIG. 5.
Group and individual spike rate data of modulated (column A) and unmodulated (column B) stimulus pulse trains for four response rate groups over time. The four response rate groups (R1–R4) were determined using rates computed over the initial 50 ms (onset) analysis window. Individual ANF data (thin lines) and group trends (open symbols with solid lines) are plotted as a function of time after stimulus onset. Mean (across-fiber) rate-vs-time functions for both modulated and unmodulated trains are shown in C for the four onset-rate categories indicated by different symbols. Error bars on the symbols indicate standard errors of the means. Mean absolute rate decrements and mean “degree of adaptation”, or normalized rate decrements for the two stimuli and the four rate groups are plotted in D and E, respectively.

