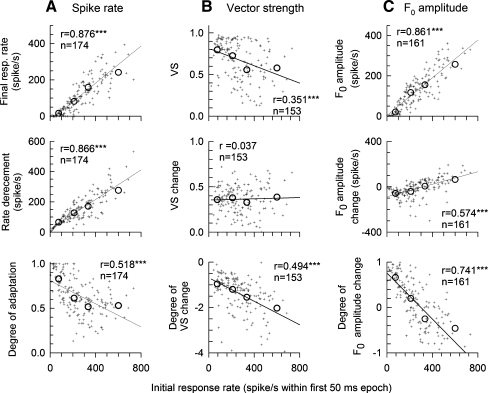
FIG. 8.
Summary of the effects of onset spike rate on rate adaptation (A), VS (B), and F0 amplitude (C). Three outcome variables of each measure are plotted in each row. While all the measures were computed for the asymptotic (final) analysis window, the data are plotted versus onset spike rates. Individual data are plotted using small symbols. The large circle symbols within each graph represent mean values obtained over the four rate groups (R1, R2, R3, and R4). Line segments indicate linear regression solutions. The correlation coefficient (r value) of each regression analysis is indicted in each plot. Except for “VS changes”, all outcome measures are significantly correlated to the initial spike rates.

