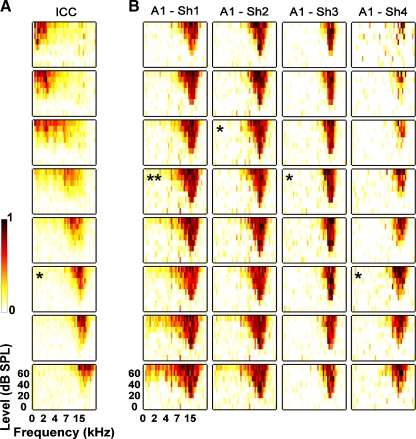
FIG. 2.
Frequency response maps (FRMs) recorded on 8 different sites (only 8 of 20 sites shown) along the tonotopic gradient of the central nucleus of the inferior colliculus (ICC) with the AMI array (A) and on 32 different sites within a specific frequency region (~16 kHz) of the primary auditory cortex (A1) with a multi-site probe (4 shanks each with 8 sites) (B). For each FRM, the x-axis is frequency (0–30 kHz, 8 steps/octave) and the y-axis is stimulus intensity (0–70 dB SPL, 10 dB steps). The color scale corresponds to normalized driven spike rate where all negative FRM values were set to zero to improve visualization. The FRM labeled with an asterisk in A corresponds to the selected AMI site (16 kHz region) used for electrical stimulation in the ICC. The FRMs in B with an asterisk correspond to sites located within the main input layer of A1 and the double asterisk represents the site selected for analysis since it had a best frequency closest to that of the ICC site.

