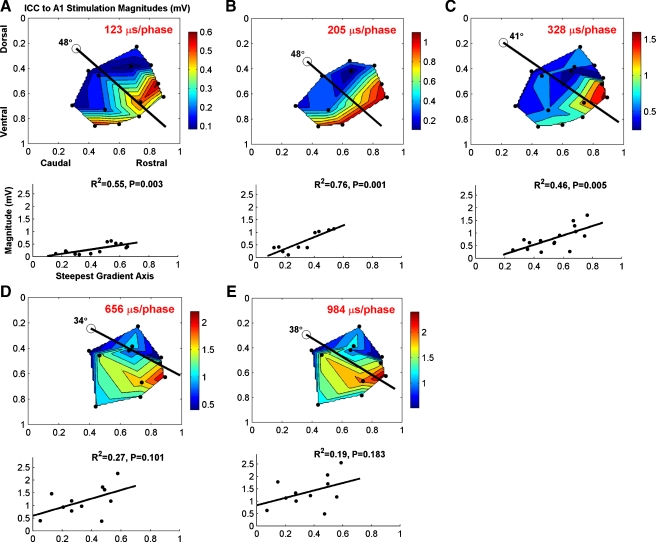
FIG. 7.
Contour plots of evoked potential magnitudes in the primary auditory cortex (A1) as a function of stimulation location along the normalized isofrequency domain of the central nucleus of the inferior colliculus (ICC) for one stimulus level of 40 dB relative to 1 μA. Each pair of plots (A–E) corresponds to a different phase duration (PD). Each dot corresponds to a different stimulation site. In each contour plot, a black line is present that corresponds to the steepest gradient axis for peak magnitude values, as depicted in the plot below that shows magnitude versus location along that steepest axis (at an angle below the horizontal line; 0 along the steepest gradient axis corresponds to the location of the circle in the contour plot). For all PDs, there was a significant trend of higher magnitudes for more rostral–ventral locations of the ICC. For longer PDs (656 and 984 μs), this trend was no longer significant (P > 0.05). The color scale of the contour plots corresponds to magnitude values in millivolts (mV). Not all the same locations are used for each plot since different phase durations were used for different sites and animals (see Table 1). The most caudal–dorsal locations are not included because no visible activity was present at 40 dB. This specific level was selected to present one example of how magnitude values change with ICC stimulation location. For more details on how we identified the different ICC locations or calculated the steepest gradient axis, see “Methods”.

