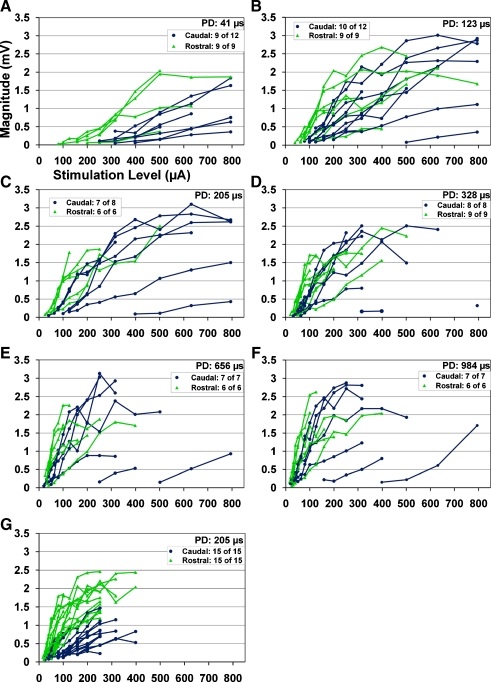
FIG. 8.
Evoked potential magnitudes recorded in the primary auditory cortex as a function current level for different stimulation locations in the central nucleus of the inferior colliculus (ICC) and phase durations (PDs) (A–E). Some of the caudal locations listed in Table 1 were not included in some of these plots since the elicited evoked potentials were not large enough to accurately measure the peak magnitude though the threshold of activation could still be determined (see legend on each plot). G Data for another series of experiments in which two shanks were simultaneously inserted into the ICC but one within a caudal region and another within the rostral region to ensure two sites within the same best frequency lamina but in different isofrequency locations. Color corresponds to the two different groups we used for analysis. For details on how we grouped the sites, see Methods: “ICC probe histology and site locations”.

