
Figure 2.
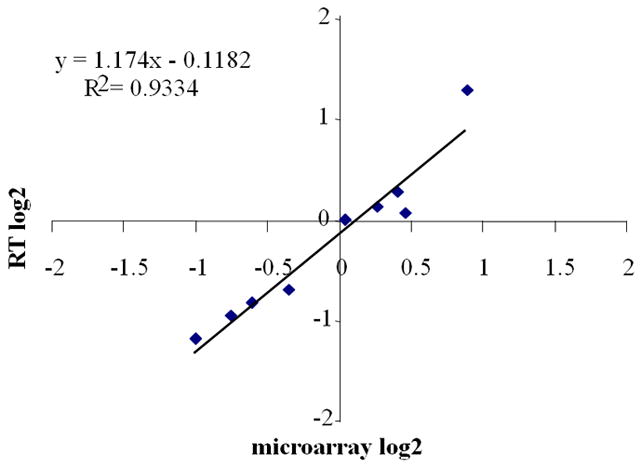
Validation of microarray-assayed gene transcript abundance by real-time quantitative RT-PCR. Log2-transformed microarray transcript abundance data (Ndom-S vs. Keele and Nson-M vs. Keele ratio) for eight genes were plotted against the log2-transformed transcript abundance data obtained by real-time quantitative RT-PCR. The Pearson correlation coefficient (r=0.96), best-fit linear-regression analysis (R2 = 0.93), and slope of the regression line (m = 1.174) showed a high degree of correlation between the two assays in terms of the magnitude of the regulation. The individual values for all these genes are presented in Table S7.