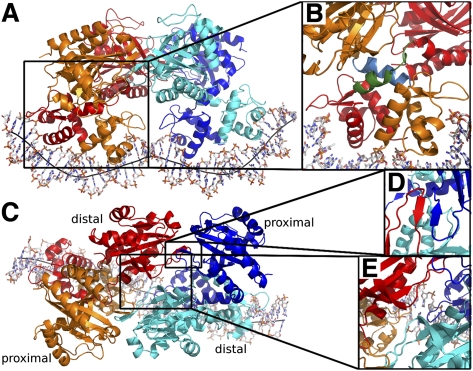
Figure 2.
The TtgV–DNA structure. (A) Viewed from the side. Each TtgV monomer is colored differently. The black line indicates the DNA axis. (B) Magnified view of one cis-dimer showing the different linker helix conformations. The linkers are shown in green (distal) and cyan (proximal). (C) Viewed from the top highlighting the skewed diamond shape formed by the CTDs. Proximal and distal protomers are indicated. (D) Magnified view of the trans-dimer interface. (E) Magnified view of the interaction between the diagonal distal protomers.

