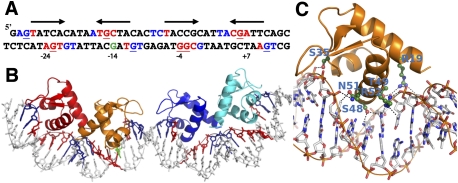
Figure 4.
TtgV–DNA interactions. (A) The 42-bp ttgG operator used in the study. The pseudosymmetry of each binding site is indicated by arrows. Red bases indicate the DNA bases that interact with TtgV in the major groove, while blue indicates the interacting bases in the minor grooves. Underlined bases are the sites protected by DMS methylation. The green G is the hypersensitive site. (B) The corresponding structure of the DNA and WH domains, with the DNA bases colored according to A. (C) Detailed interactions of one WH domain with the DNA. Residues that are involved in direct interactions are labeled.

