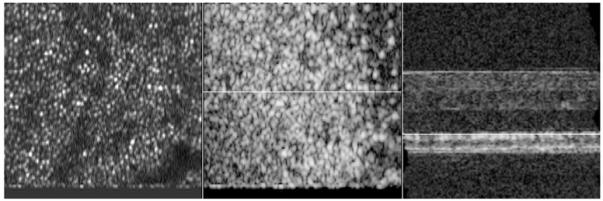
Fig. 5.

Frame No. 39 of a movie showing 3D data of the retina recorded with the instrument. Left side shows SLO images, the center shows en-face OCT images, right side shows extracted OCT B-scans. The white line shows the position of the corresponding B-scan (in the center image) and position of the corresponding en-face image (on the right hand side image), respectively. SLO images are displayed on a linear scale, OCT images are displayed on a logarithmic scale. Field of view of SLO and en-face OCT images: 0.8°×0.8°. Dimension of OCT B-scan: 0.8° × 1mm (To reduce file size, the pixel extension of the original movie was reduced by 70%)
