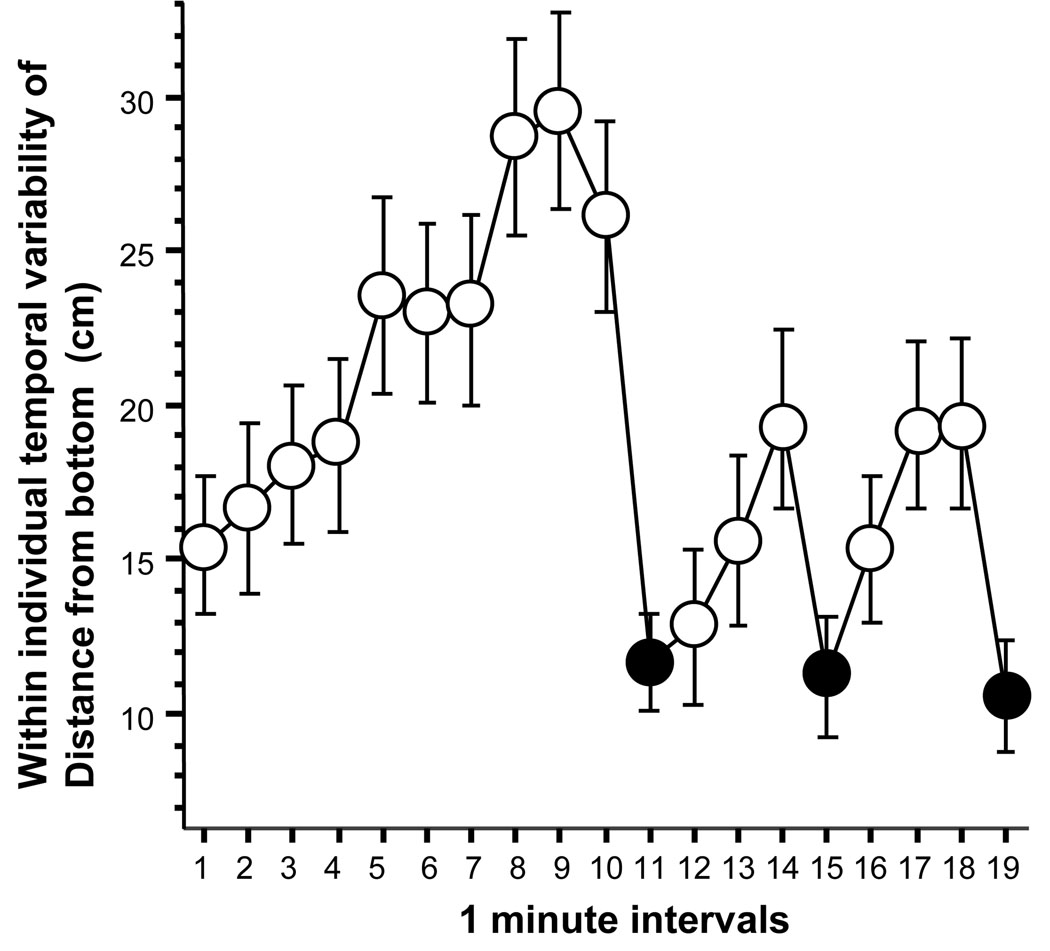
Figure 4.
The within individual (temporal) variability of distance from the bottom significantly decreases in zebrafish in response to the presentation of a moving image of the Indian leaf fish. Mean ± SEM are shown. Sample size n = 60. Empty circles represent 1-min intervals during which the predator image was not shown (blank stimulus screen). Black filled circles represent the 1-min intervals during which the predator image was presented.

