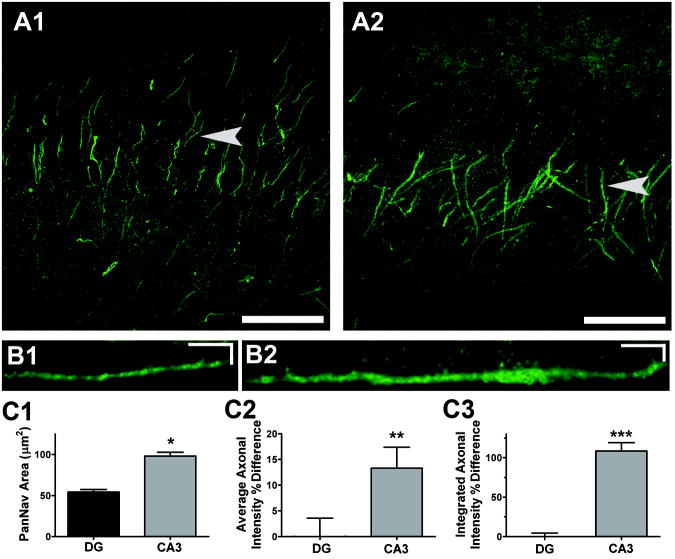
Figure 3.
The CA3 pyramidal axons have a greater area and density of Nav alpha-subunit immunoreactivity than DG axons. A. PanNav immunoreactivity within DG (A1) and CA3 (A2) regions shown by three dimensional confocal reconstructions. Scale bars are 50 μm. B1-2. Stretched side views (created with Metamorph kymograph function), of PanNav staining from a representative DG axon (B1) and CA3 axon (B2) indicated by arrows in A. Scale bars are 5 μm and 5 μm. C1-3. The axonal area (C1), density (C2), and total sum (C3) of PanNav staining on DG (n=32) and CA3 (n=32) axons. Density and total sum are expressed as a percent difference on DG and CA3 axons. *, P<0.00001; **,P<0.02; ***, P<0.0001.

