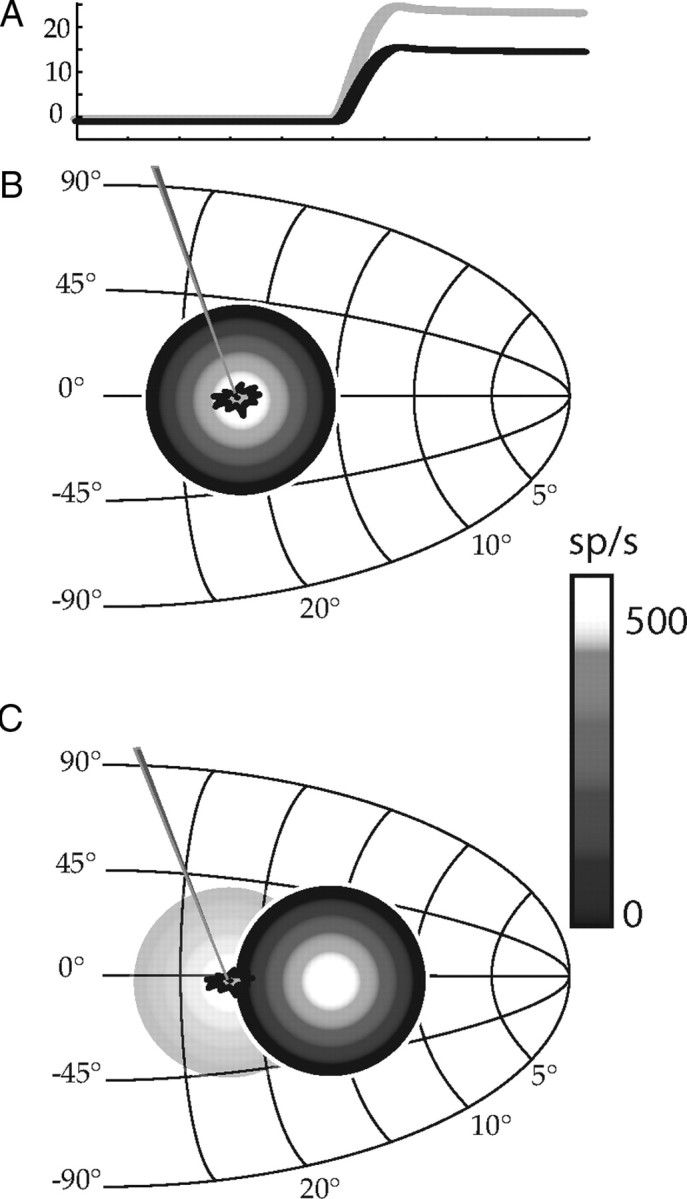
Figure 2.

Collicular movement fields. In A, horizontal saccade position is plotted as a function of time for two saccades: one to a 25° target (gray) and the other to a 15° target (black). In B, a schematic diagram of the left SC is illustrated with the hypothetical active population of cells indicated with concentric circles. The location of this population of active cells indicates a motor command specifying a 25° saccade along the horizontal meridian. Different discharge rates are indicated by different shades (see scale bar). A diagram showing the location of a neuron within this active population is shown. In C, the active population during a 15° movement is shown (the location of the population during the 25° saccade is lightly shown for comparison).
