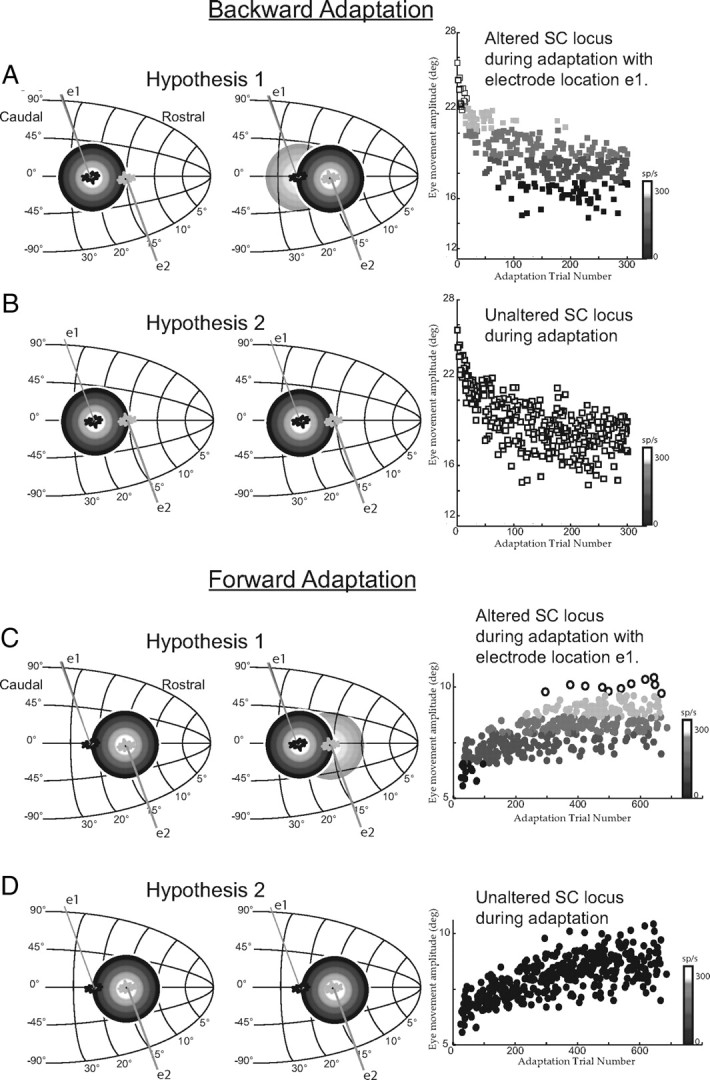
Figure 3.

Predictions of alternative hypotheses. As in Figure 2, motor activity on the SC map is presented as concentric circles (white is high activity; black low activity). Recorded neurons are indicated with drawn electrodes and cell bodies. In A, the active population during a 25° horizontal control movement, and a cell located at the population center (electrode position e1) and a second located at the rostral edge of the population (position e2). Hypothesis 1 posits a change in the locus of SC activity during adaptation. This is indicated in the middle. If activity were recorded from a cell at electrode position e1, at the start of adaptation discharge rates would be high. This is shown in the right-most panel that plots saccade amplitude as a function of the number of adaptation trails and the shading of points indicates the discharge rate of a hypothetical cell. Early in adaptation the cell is at the center of the active population and discharges vigorously. As movement amplitudes decline the active population is presumed to move to more rostral sites and activity is predicted to decline. B presents the predictions of the alternative hypothesis (hypothesis 2) using the same layout. This hypothesis predicts no change in location of the active population in the SC. The recorded neuron (position e1) remains at the center of the active population throughout the adaptation process. Thus at the end of adaptation, movements that are much smaller than control movements to T1 are associated with high discharge rates. In C and D, the predictions of these two alternative hypotheses are presented during forward adaptation. The layout is the same as in A and B.
