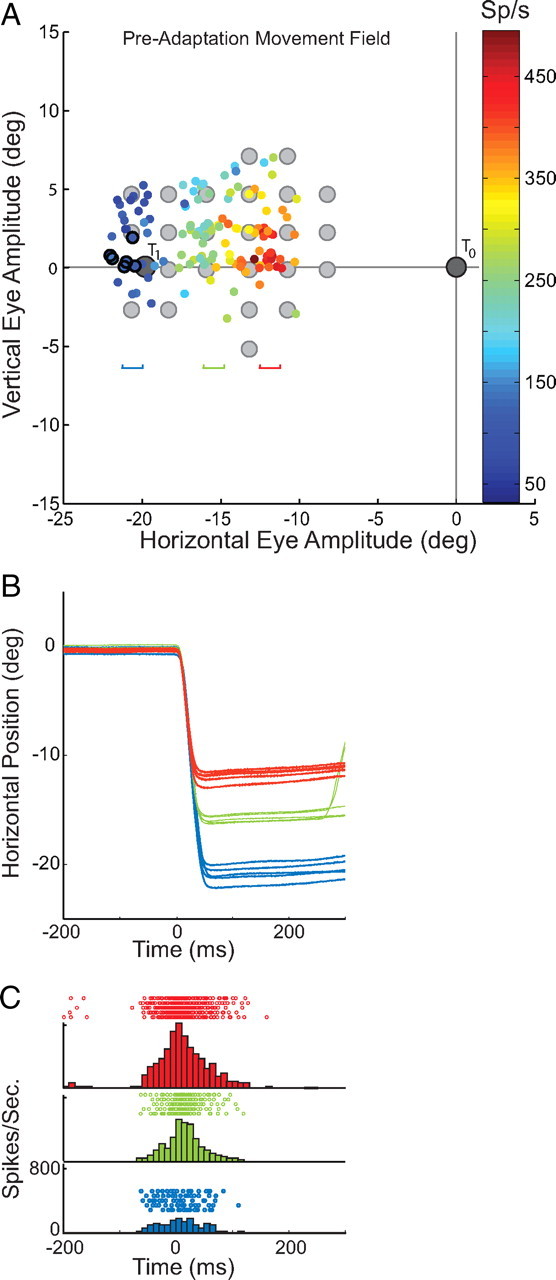
Figure 4.

Preadaptation movement field. A plots the preadaptation movement field for neuron U2. Gray filled symbols indicate target locations including the T1 location. Data points encircled in black are preadaptation trials to the T1 location. Three groups (n = 6) of movements having different amplitudes are selected for display and horizontal position is plotted as a function of time in B. Color codes indicate the region of the movement field from which these are extracted. In C, rasters for each trial, and histograms for each group aligned on movement beginning are illustrated for comparison.
