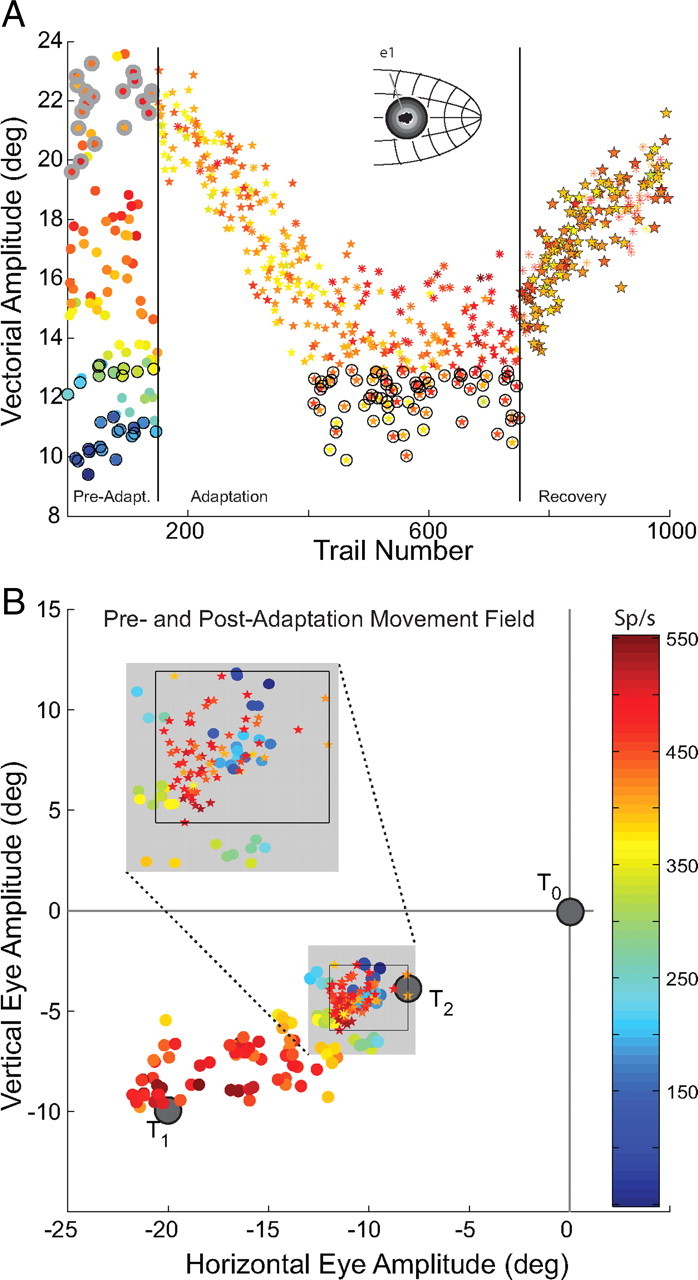
Figure 6.

Example with electrode position e2. This figure has the same layout as Figure 5 but demonstrates the results of placing the T1 target during preadaptation such that the recorded neuron is located near the center of the active population (inset in A). Also shown are trials in which the T1 target is re-illuminated (recovery). Pre- and postadaptation movement fields are superimposed in B. Color bar in B applies to both A and B. Recorded cell is number U12 in Table 1.
