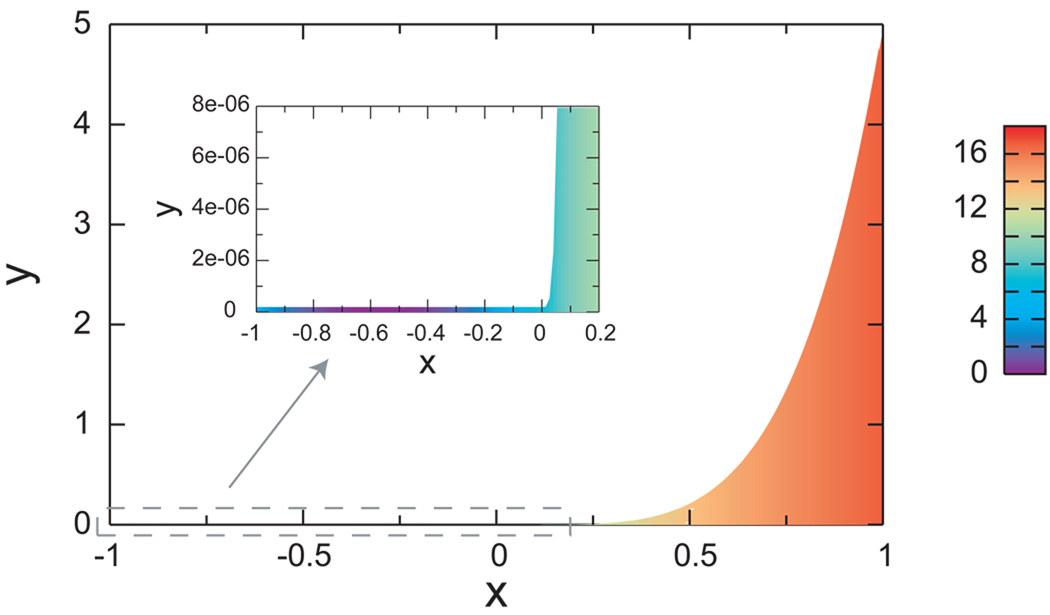
Figure 1.
A schematic representation of the two-dimensional potential function used here. The colored area corresponds to the accessible region of the (x, y) plane, with the colors representing the magnitude of the potential energy at that (x, y) point (scale bar in kcal/mol). The potential energy is infinite in the non-colored region and for y < 0, x < −1, and x > 1. The inset is an enlarged view of the folded macrostate and transition region.

