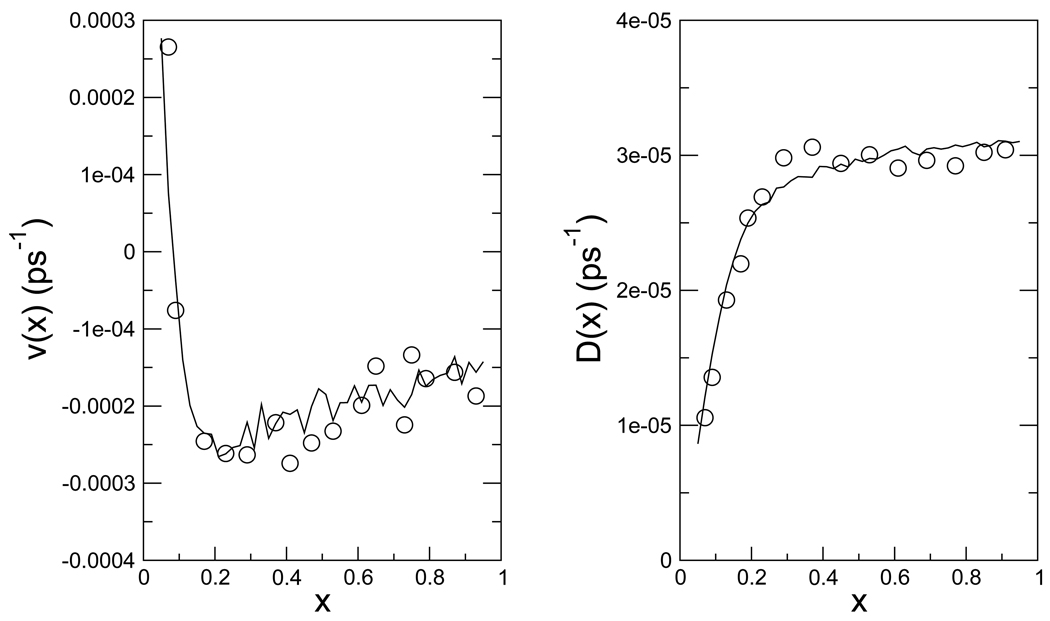
Figure 3.
The drift velocity v(x) and diffusion coefficient D(x) along the reaction coordinate x at 298 K. The lines represent the drift velocity and diffusion coefficient of the kinetic MC simulation on the continuous potential, while the circles are the results from the discretized kinetic network model after calibration of c0.

