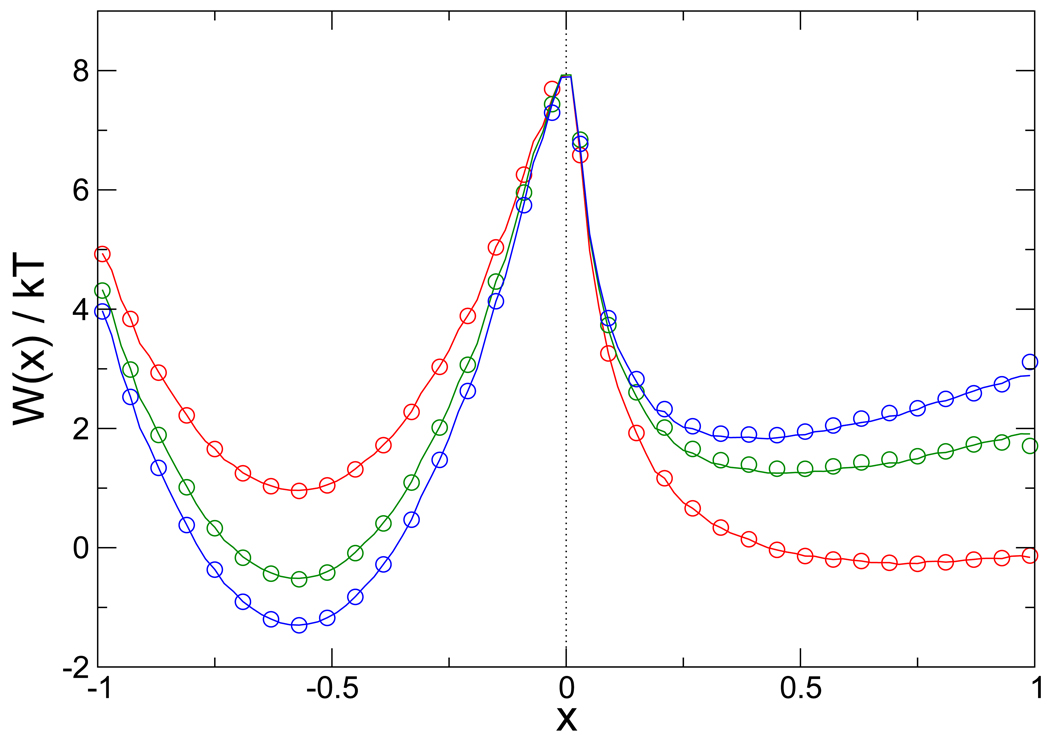
Figure 6.
The PMF along the x coordinate at the three temperatures 395 K, 431 K, and 526 K (blue, green, and red, respectively). Solid lines are the exact PMFs calculated by numerical integration of the potential, while the circles are derived from kinetic network simulations at each temperature. Approximately 103 barrier crossings were observed in the 1 hour of wall clock time required for each simulation.

