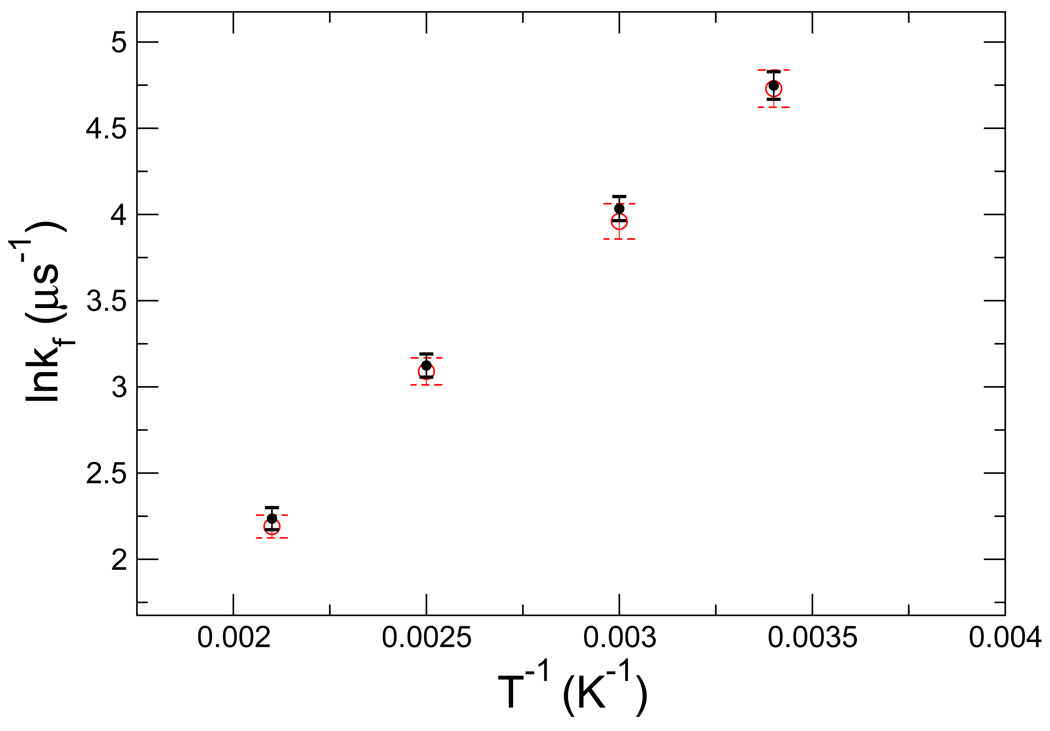
Figure 7.
Arrhenius plot of the folding rates of the model system. The solid symbols represent the folding rate from kinetic MC simulations on the continuous potential in unit of 10−6 per MC step. The open circles represent the rates from simulations of the discretized kinetic network model. The error bars represent one standard deviation, as estimated by error propagation from the first passage time distribution. Solid and dashed error bar lines correspond to the results of kinetic MC and network model, respectively.

